COVID-19 cases in the Baltic states (static graphs)
These graphs describe the development of COVID-19 by confirmed cases and deaths in the Baltic States, using data from the Johns Hopkins coronavirus map. The original model for these graphs was made by @ryancbriggs to create graphs for Canada’s provinces and territories; it has been adapted by @rmartinnielsen to do the Baltic States instead. You can also review the Rmarkdown source for this page.
Graphs
Data current as of March 01, 2021.
Confirmed cases
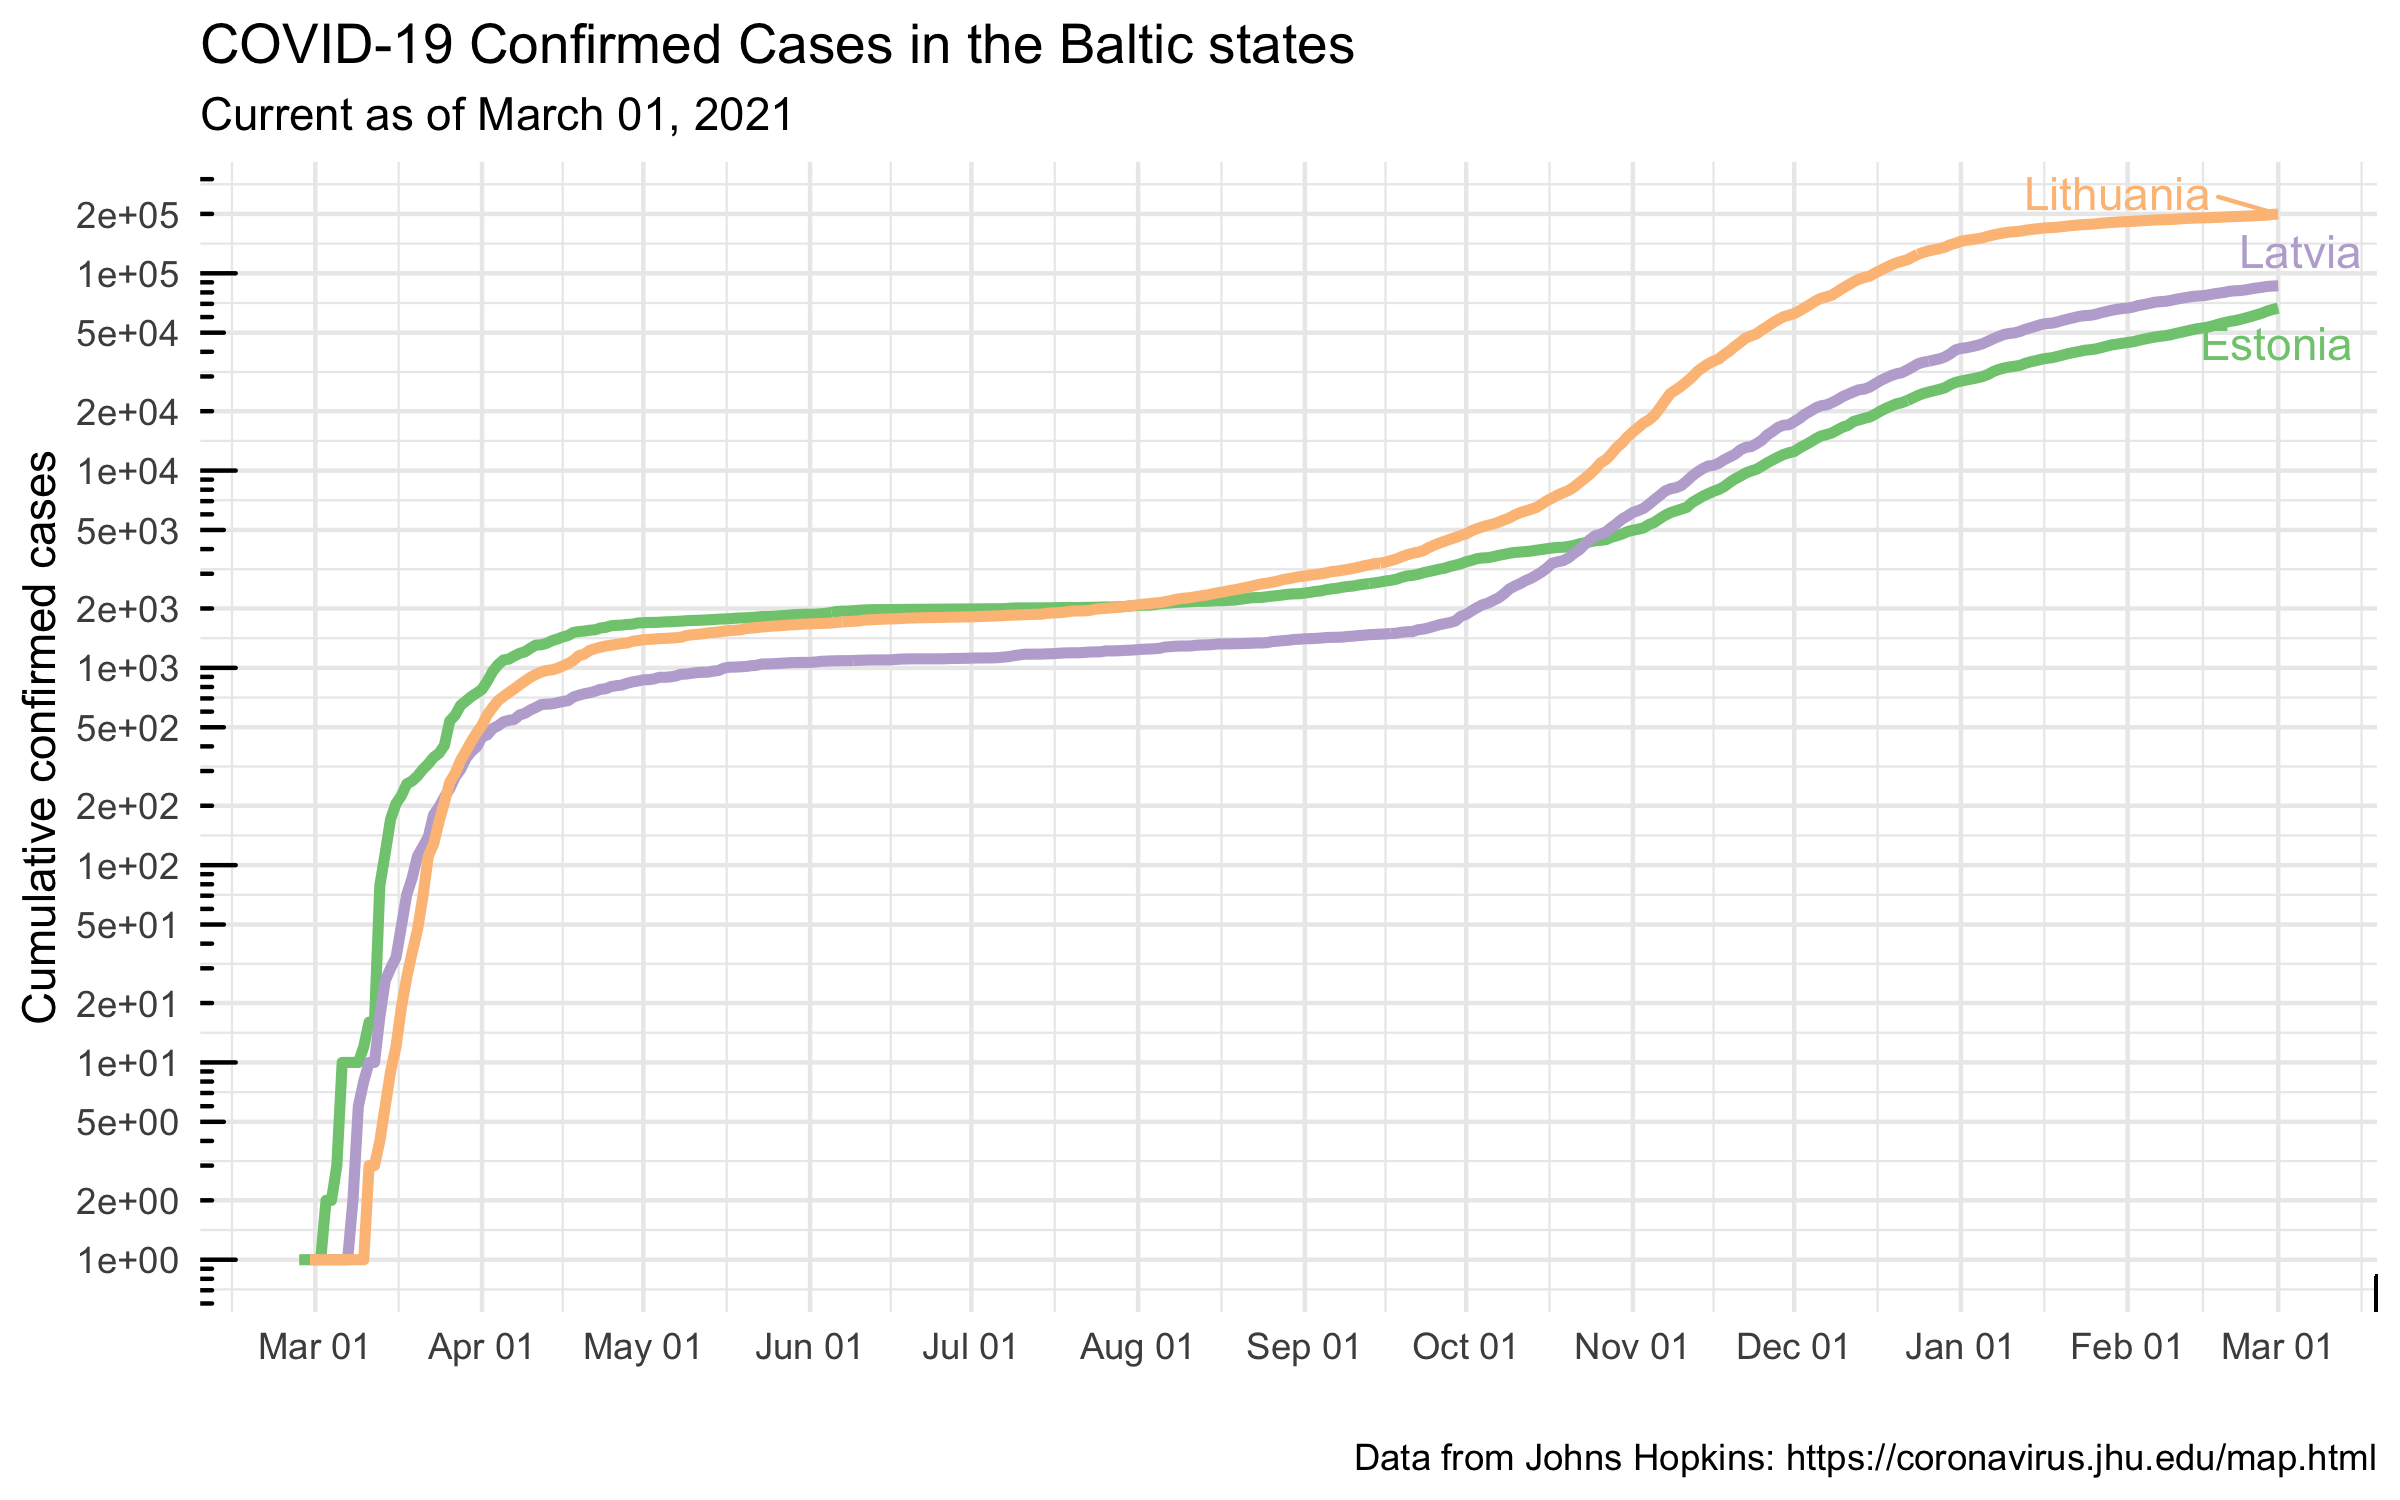
Confirmed cases in the Baltic states
Confirmed cases since 10
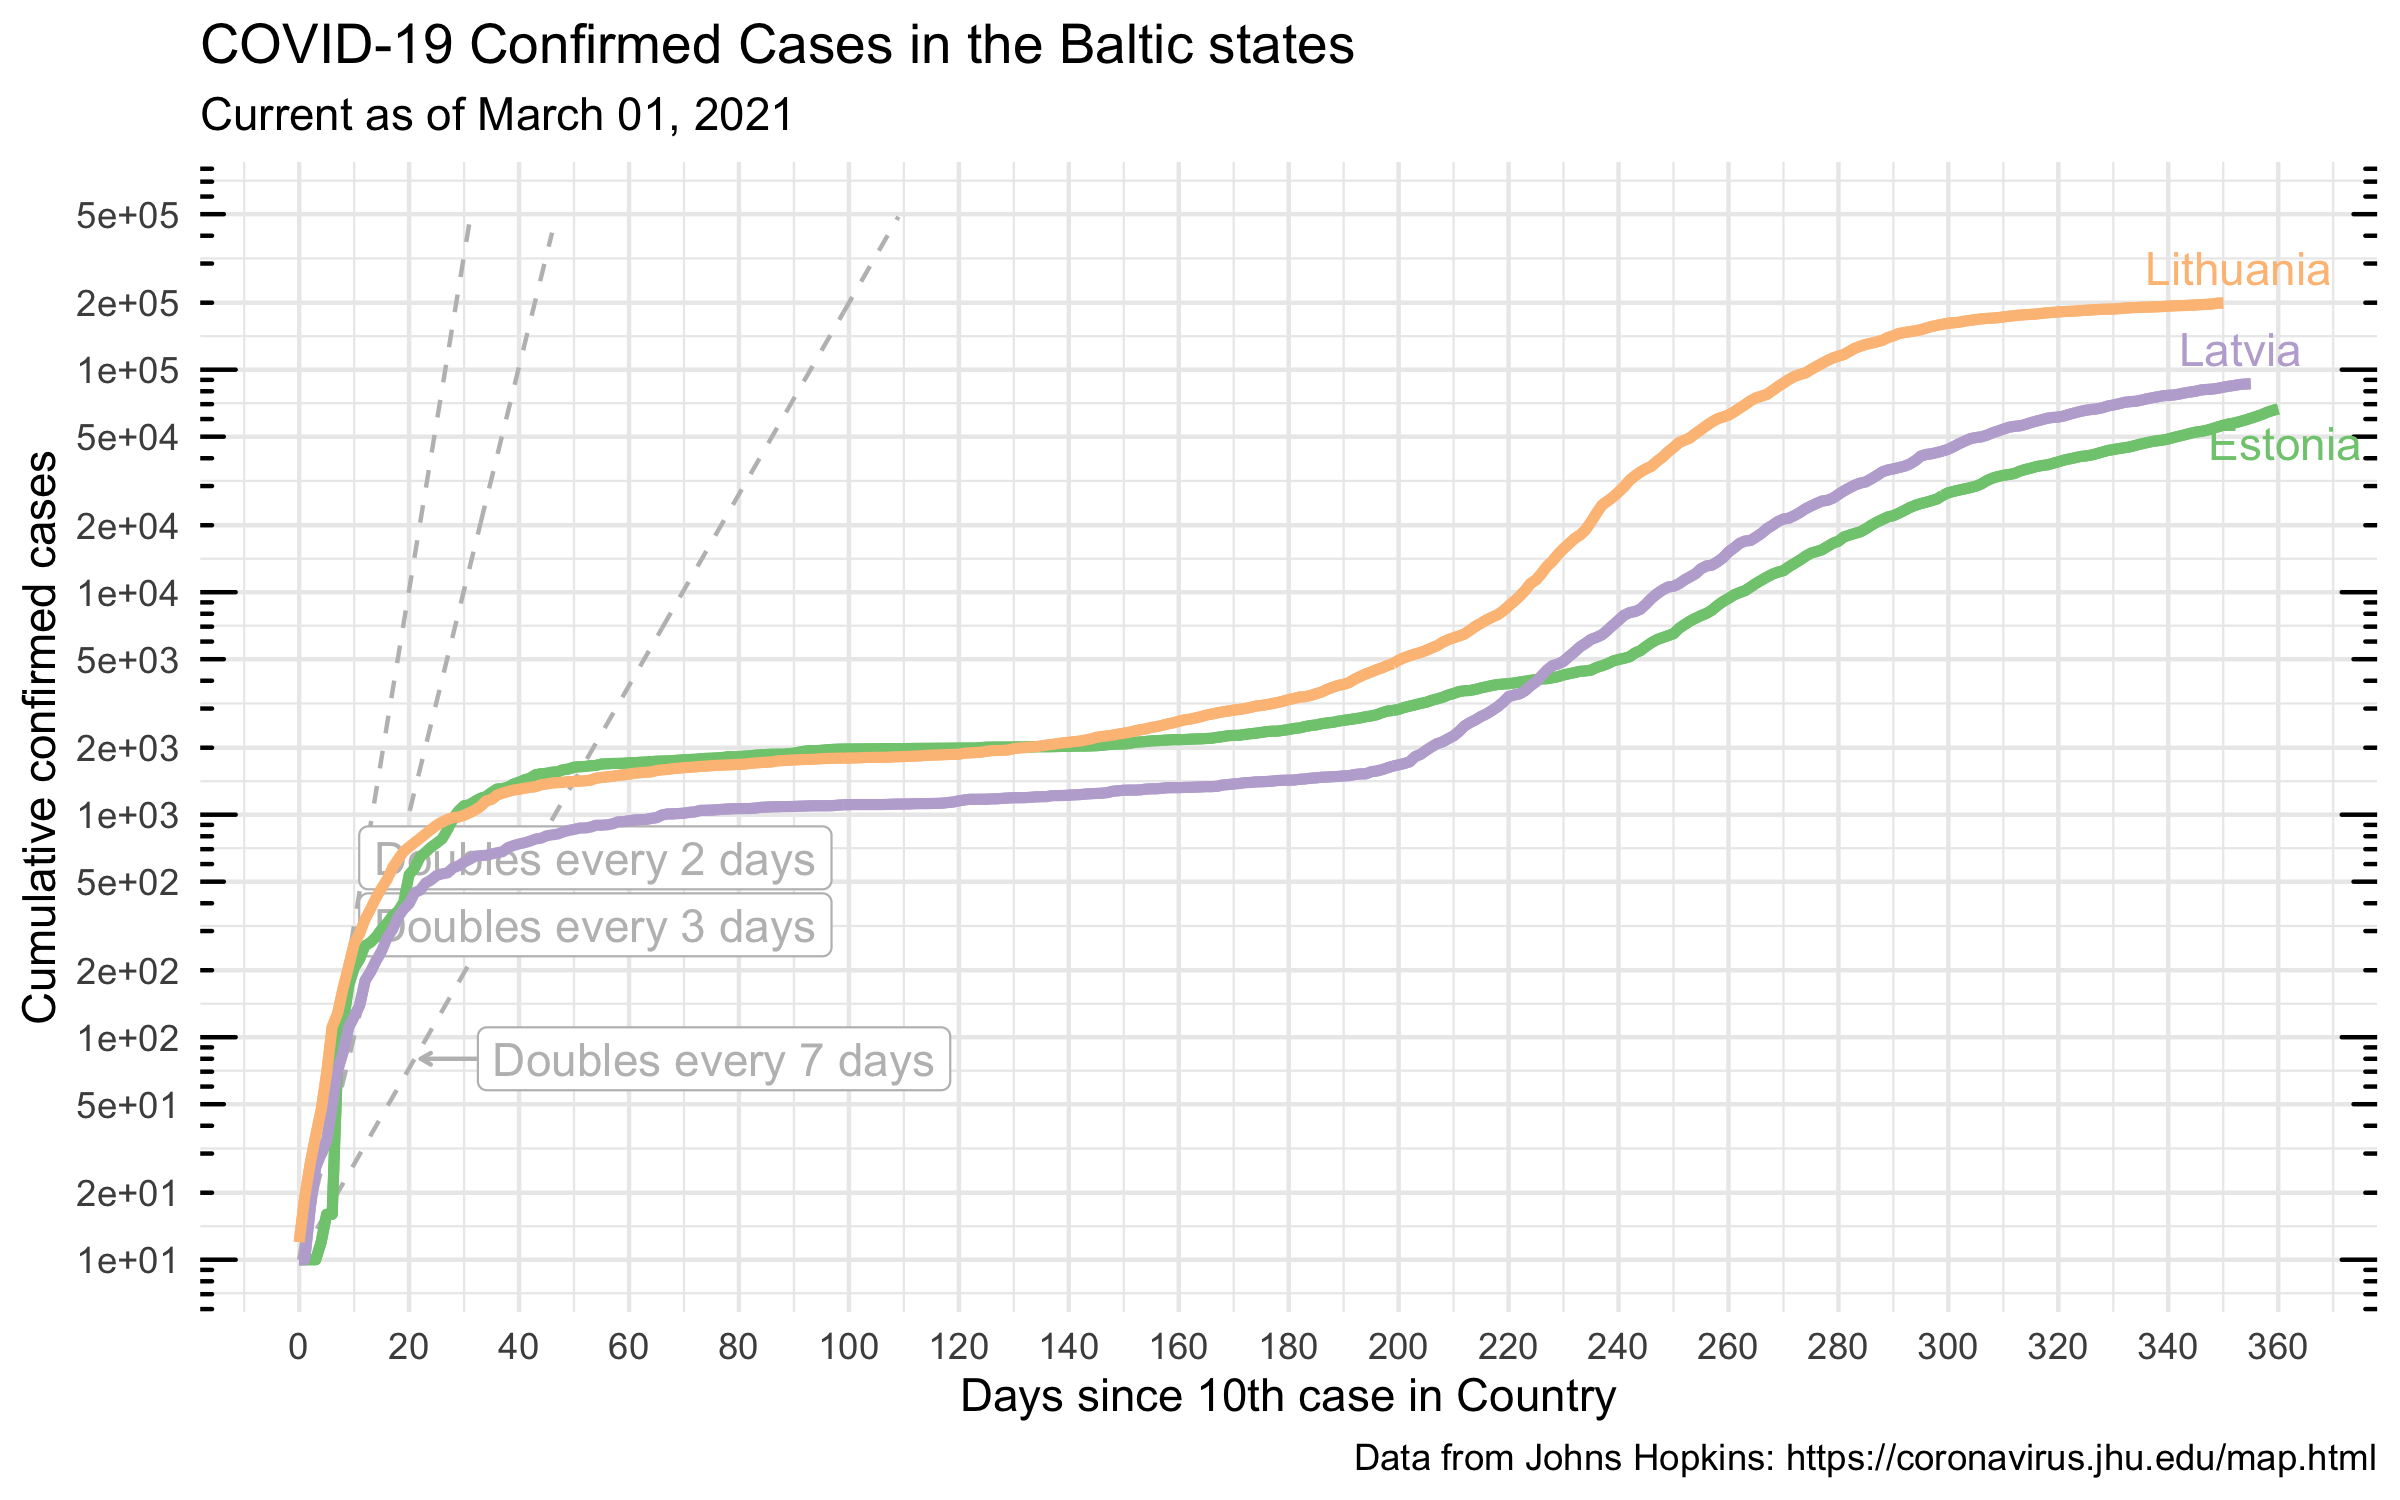
Confirmed cases since the 10th case
Confirmed cases since 100
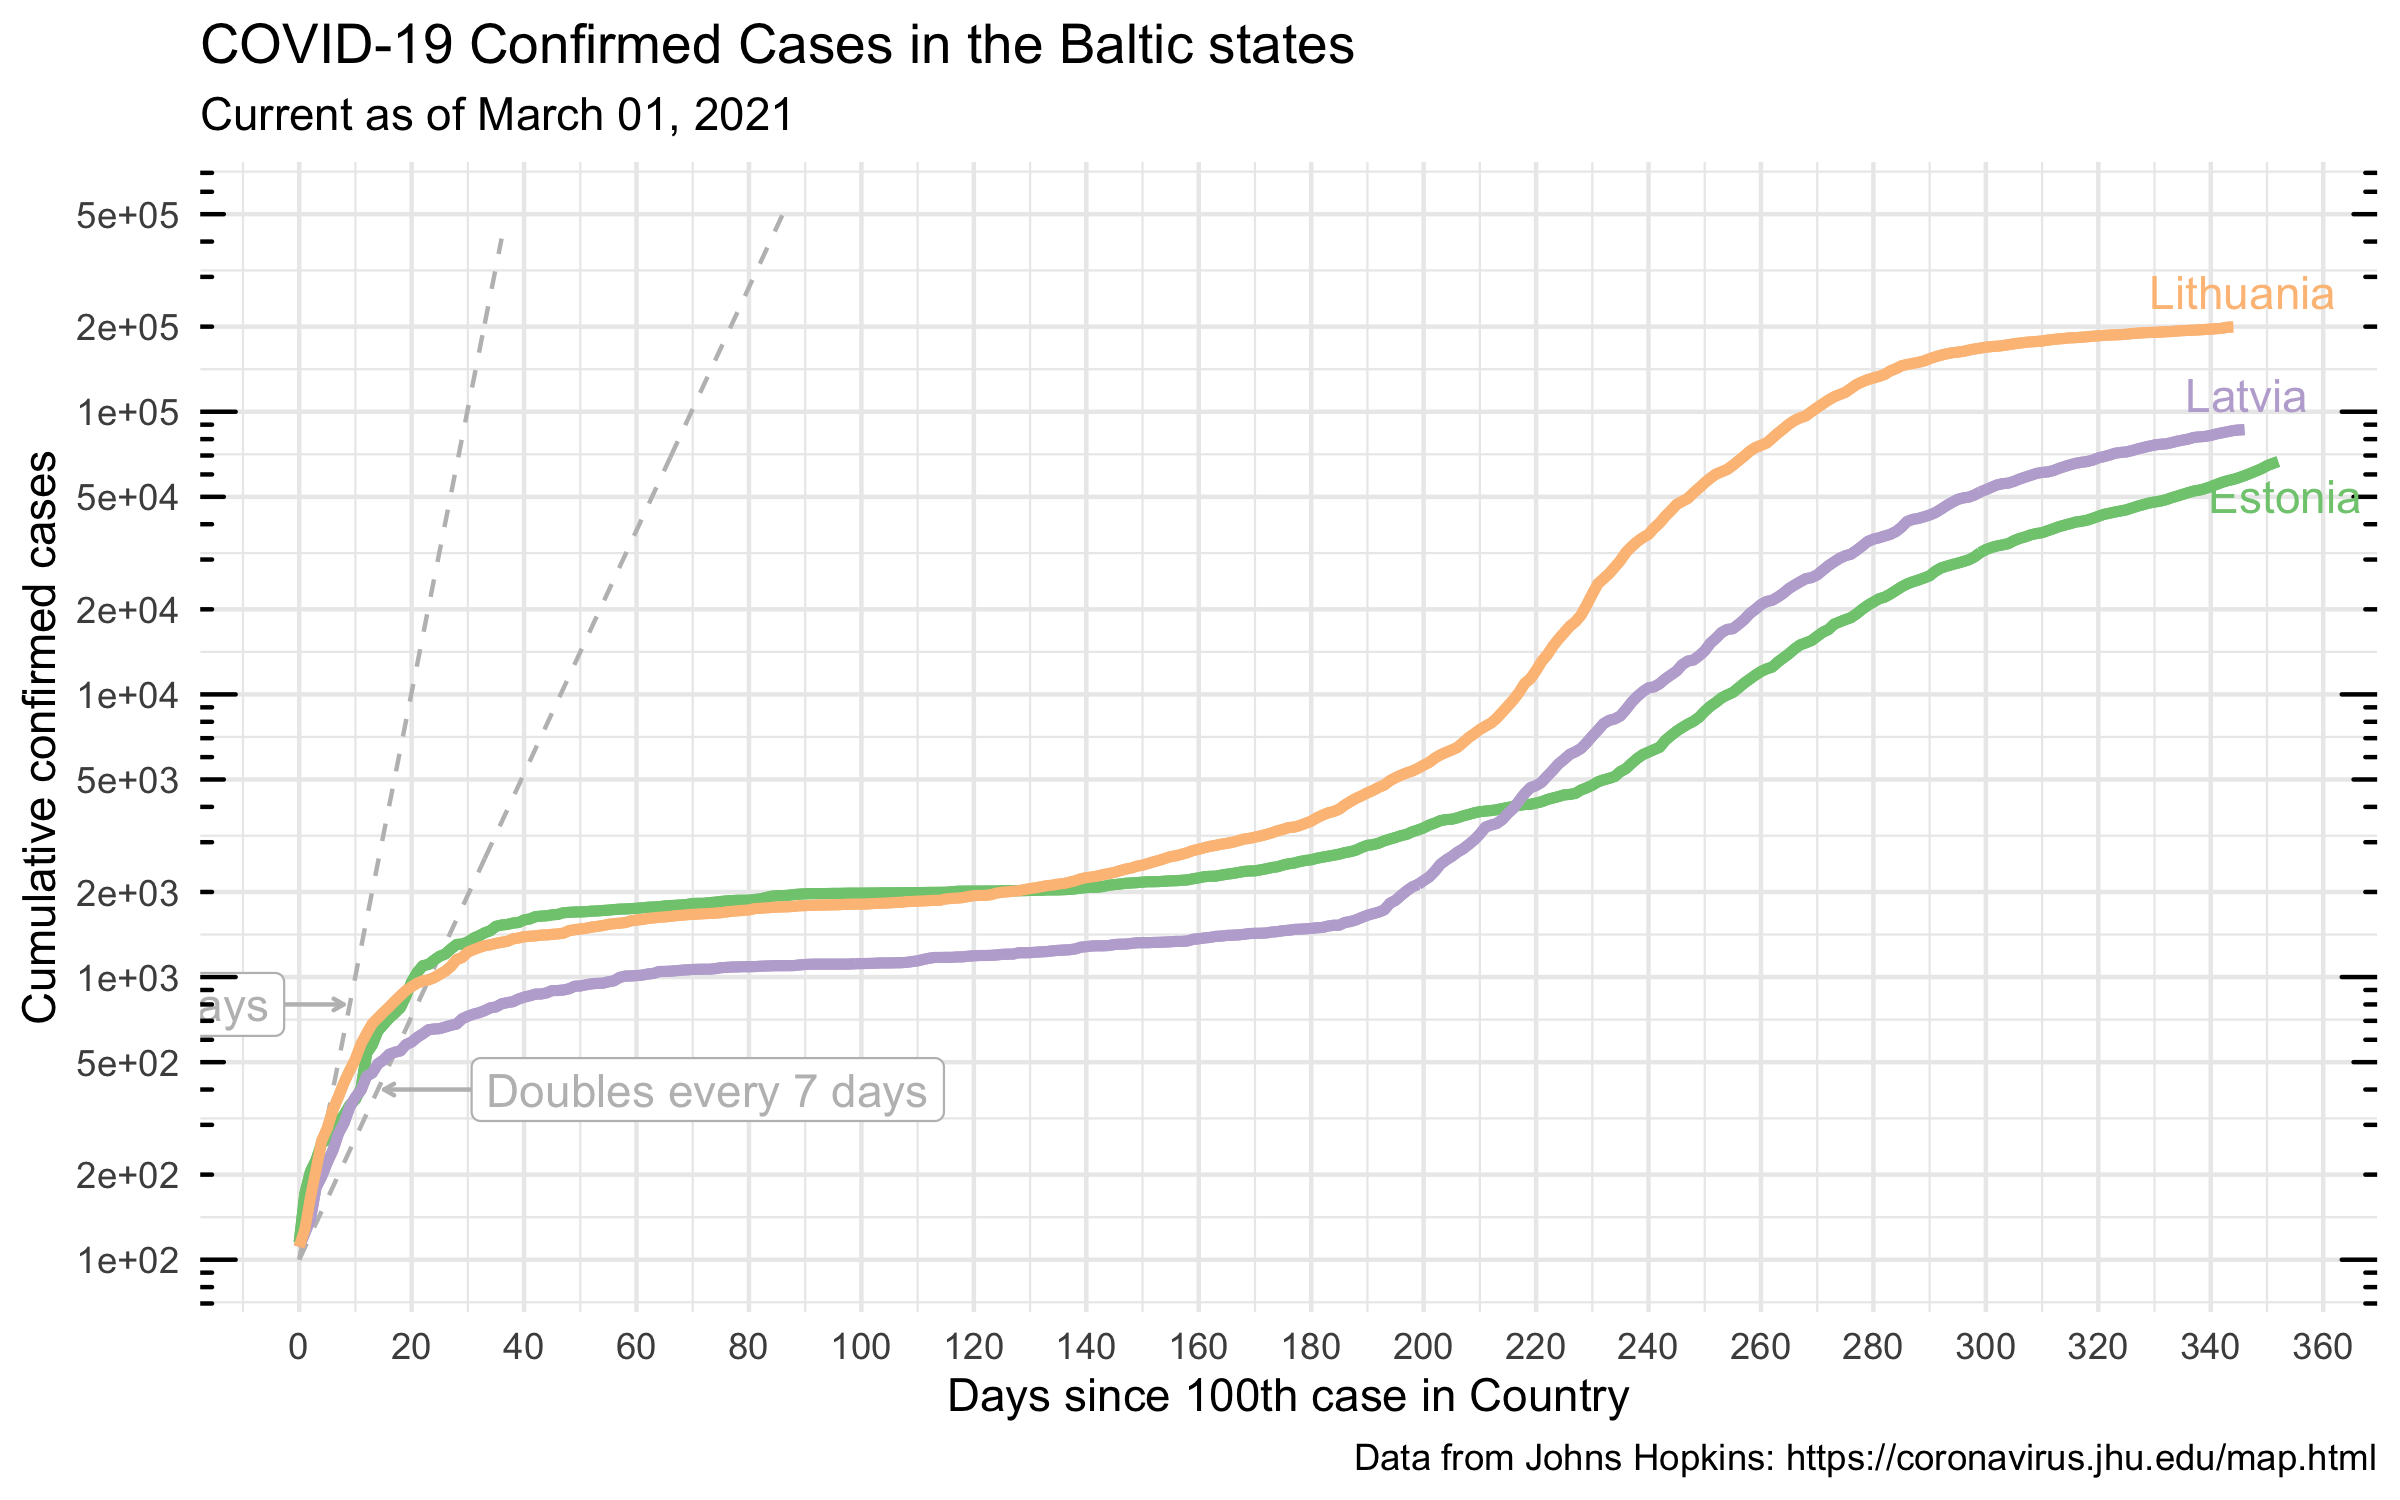
Confirmed cases since the 10th case
Deaths
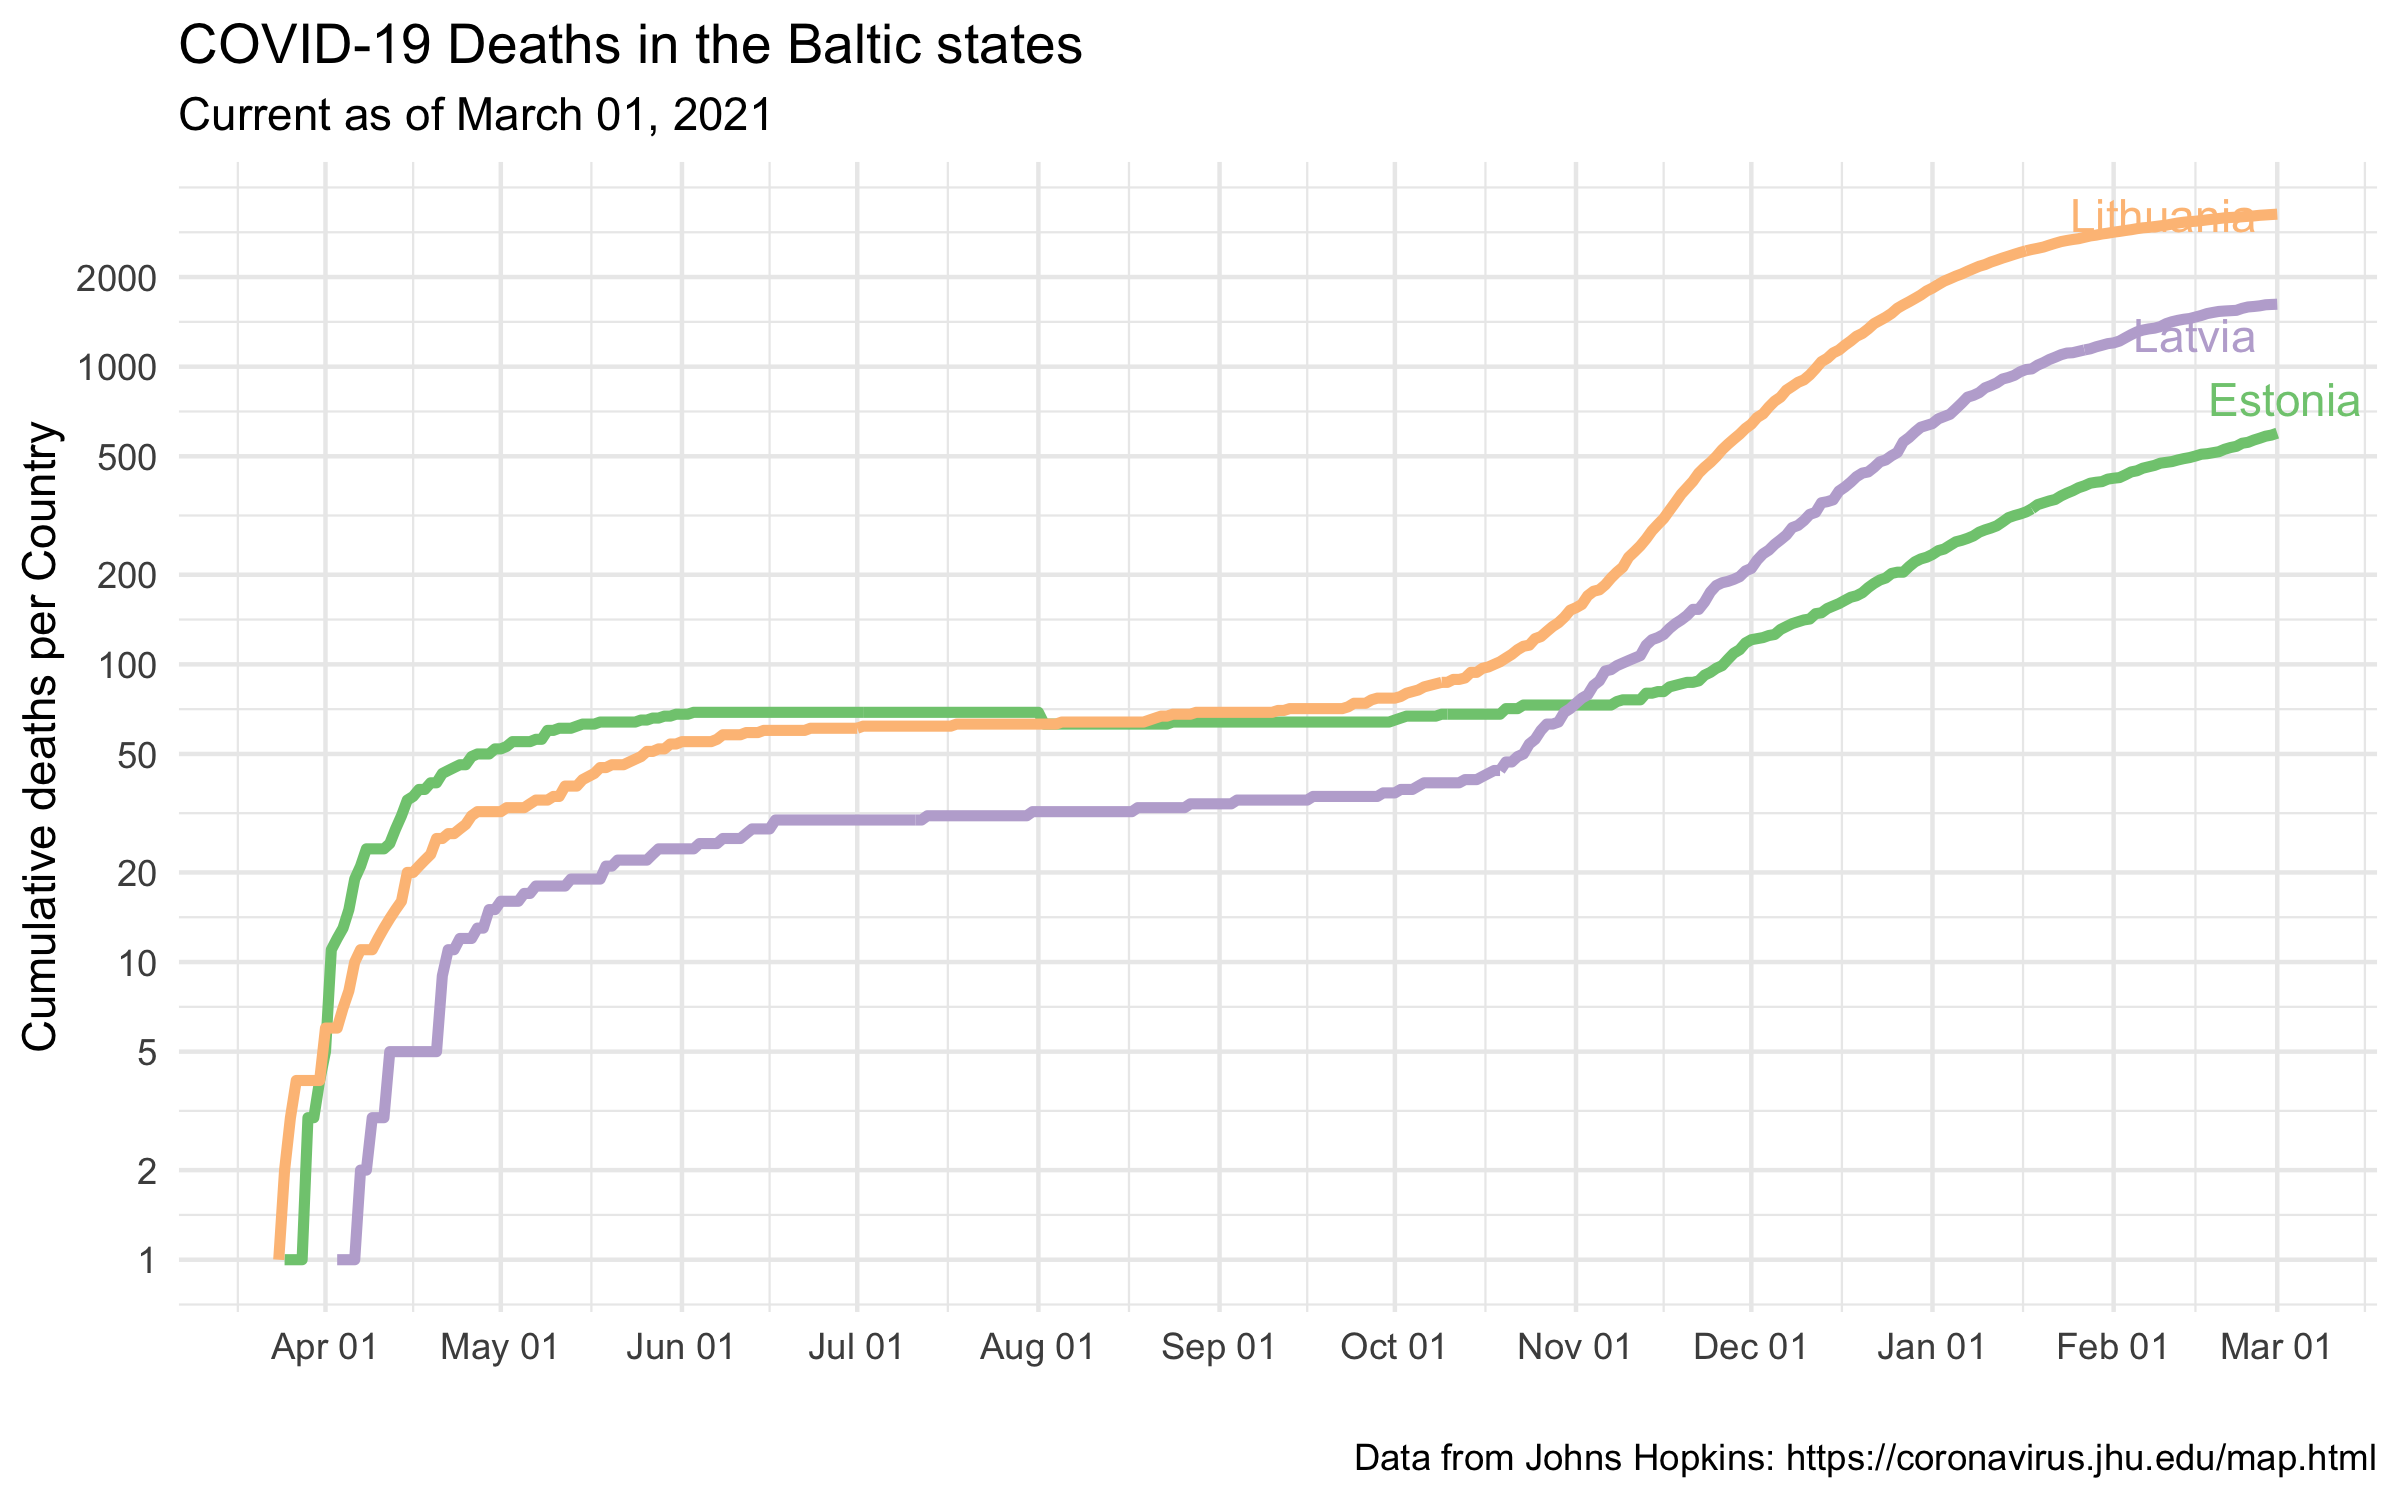
Deaths
Deaths since first death
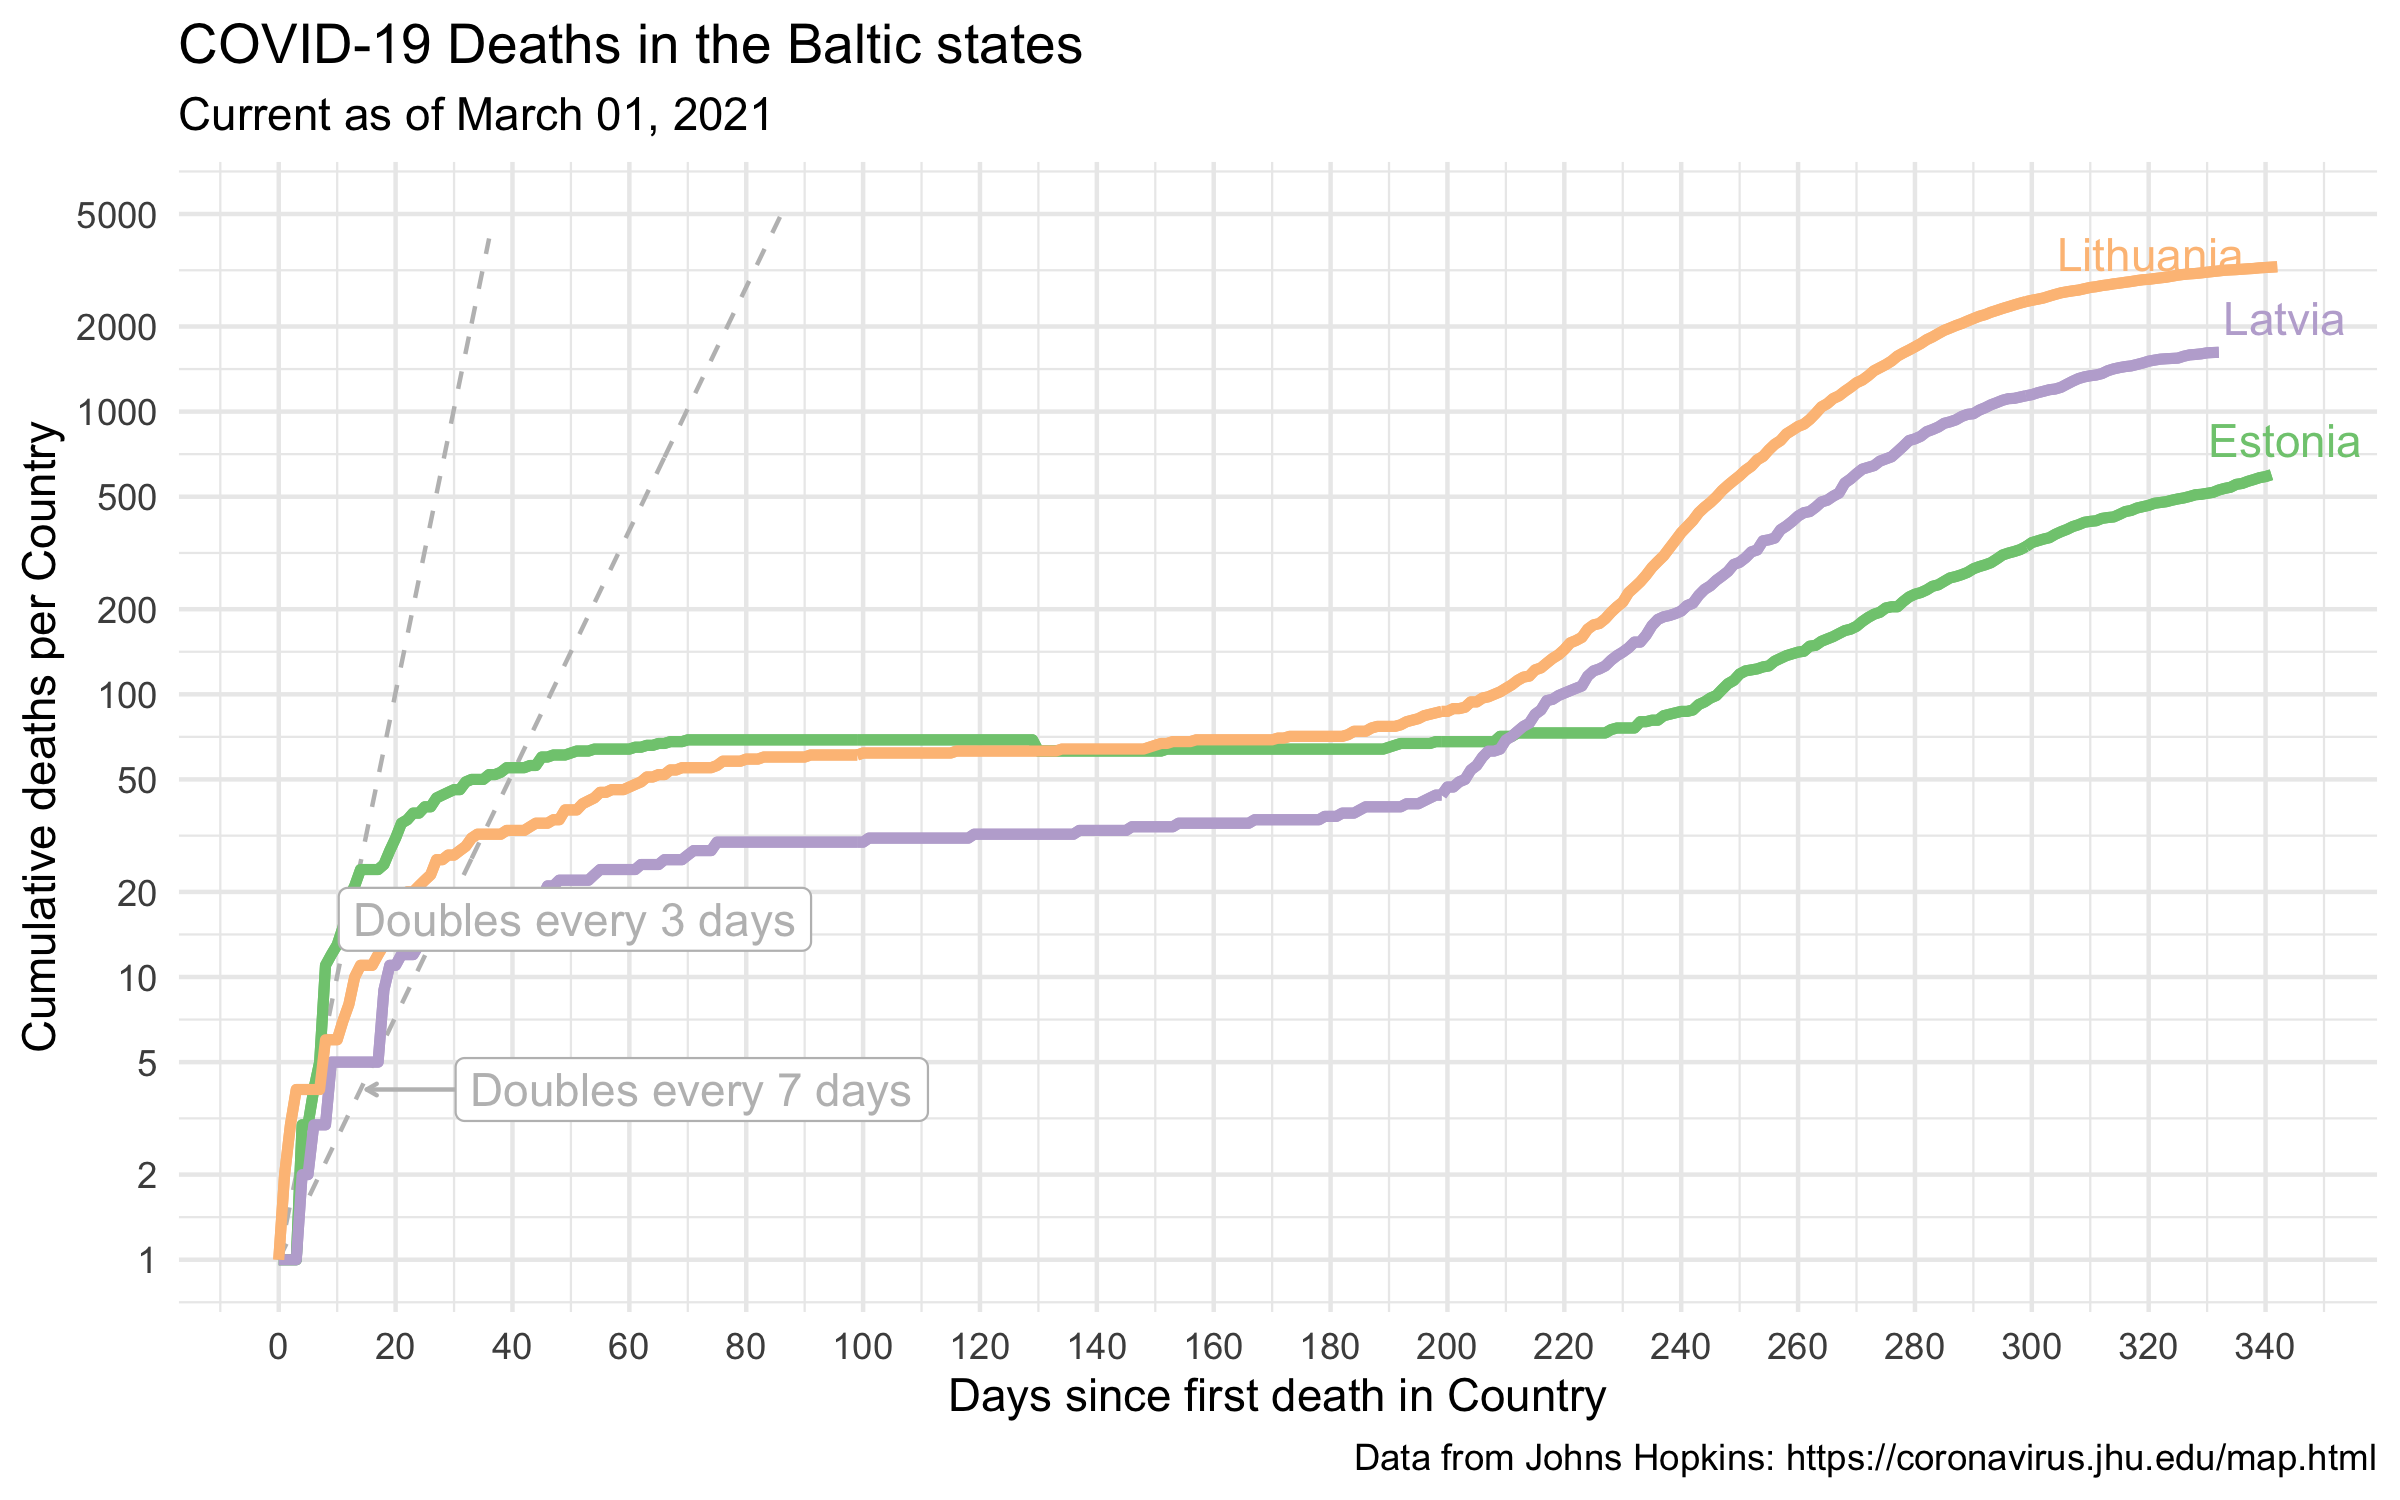
Deaths since the first death
Copyright © 2021 Richard Martin-Nielsen.