Project One-Forty-One
Can anything be predicted in Lithuanian elections?
Richard Martin-Nielsen
23/10/2020
Introduction
- Lithuania’s electoral system is complex with the Parliament formed in part by a multi-member constituency elected by proportional representation and by a nearly-equal-sized collection of single-member constituencies which are elected with two-round ballots.
- It is proverbially difficult to predict, given little polling, large errors, a low threshold for entry into the multi-member constituency, a large number of active parties, rapid evolution (creation and dissolution) of parties and a short historical trend.
- This is nonetheless an attempt to predict the outcomes in the second round of the 2020 parliamentary elections based on the voting patterns in the 2012 and 2016 parliamentary elections and the voting data from the first round of the 2020 elections.
Background
- Lithuania uses a mix of a proportional representation and single-member constituencies with a run-off.
- Advance polling might allow prediction of the make-up of the multi-member constituency, but polling errors are large compared to the threshold for winning any seats in the multi-member constituency and in 2020 there were surprises in the first round.
- Results of the first round may give a heuristic indicator of the eventual outcomes in the run-offs, based on results in 2012 and 2016.
Round I
- After the first round of polling, seats are assigned in the multi-member constituency based on proportional representation with a 5% threshold which parties must reach to win any seats. If they pass this threshold, they will get at least 6 seats.
- These form the “floor” of a party’s eventual representation in Parliament. They cannot have fewer than the seats they get in the multi-member constituency.
- A separate ballot in the first round of polling lets Lithuanians choose among candidates for their local constituency MP.
- If a candidate in a constituency wins more than 50% of the vote, they are elected to their seat.
- If no candidate gets 50% or more, the top two candidates compete in a run-off Round II, two weeks later.
Round II
- Considering Round II, parties now have a “ceiling” on how many seats they can win.
- This isn’t just the number of seats they placed first in Round I, but also includes those where they were the first runner-up (“challenger”).
- Most candidates who win in Round I win in Round II, but not all.
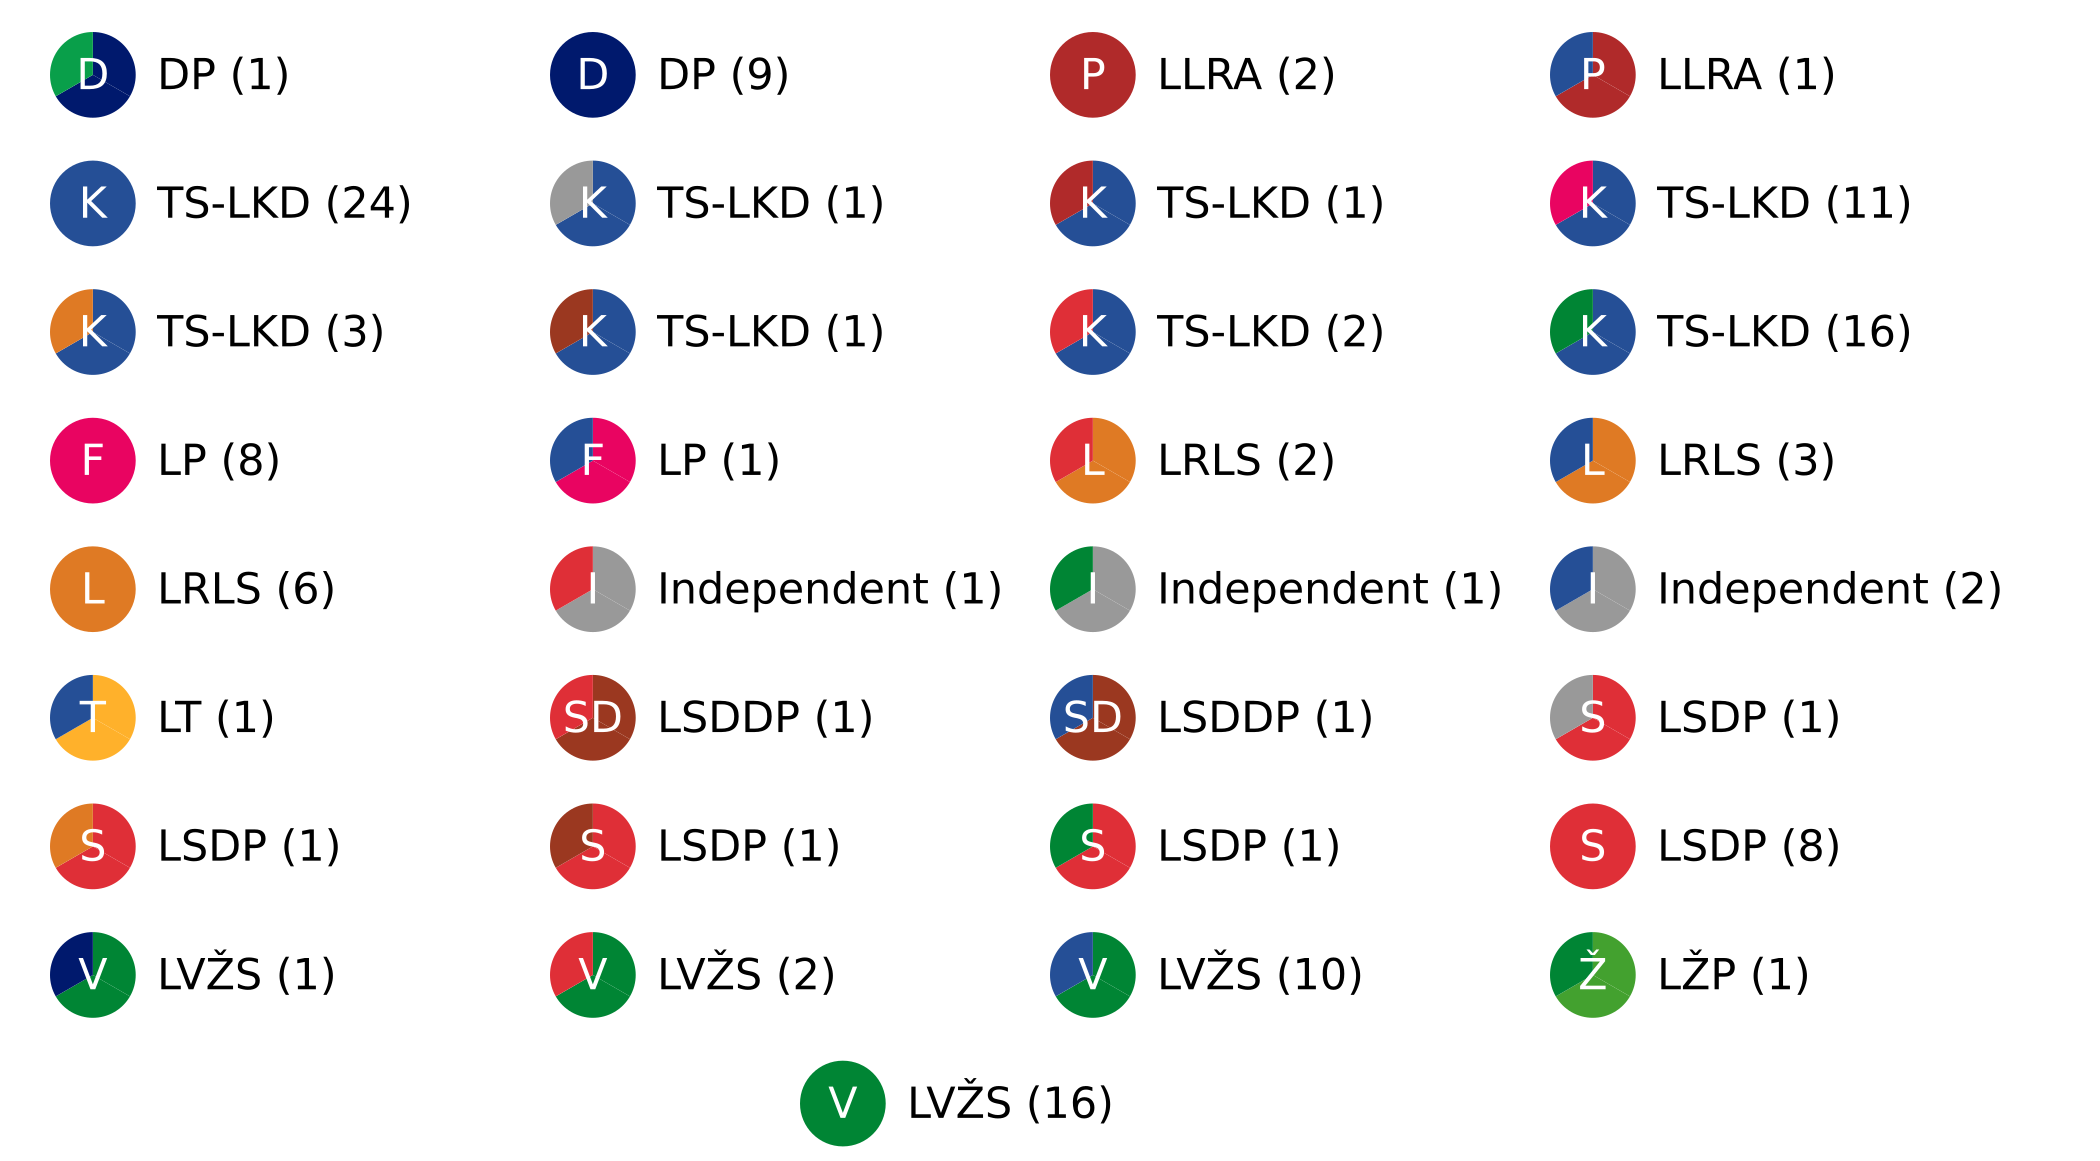
2020 - After round I
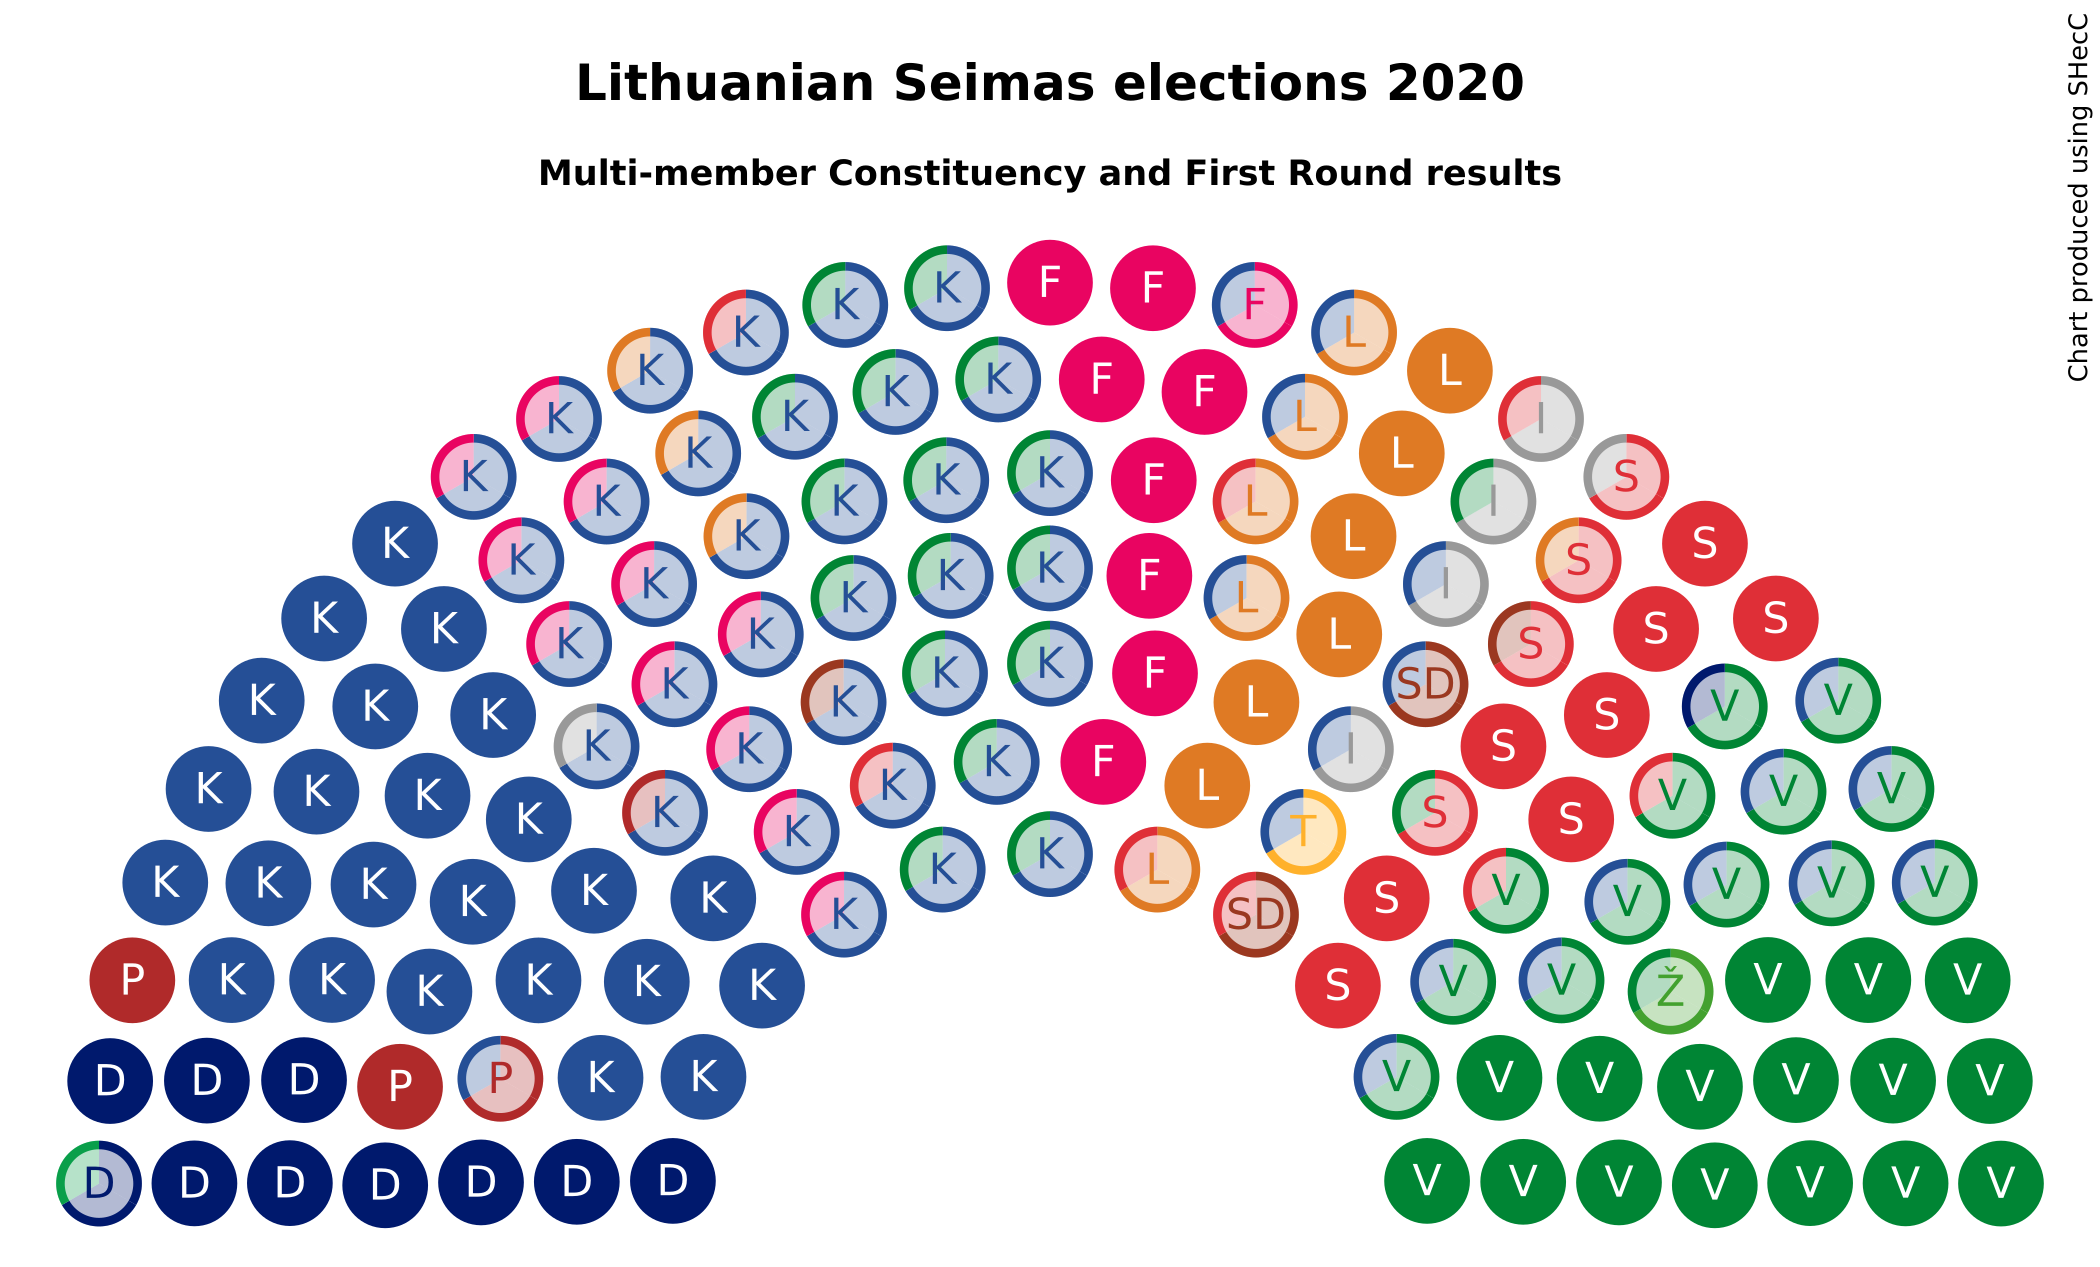
Legend
First Round Winners
In the single-member constituencies, any candidate who wins more than 50% of the vote in the first round is immediately elected.
If no candidate wins 50%, the top two ranked candidates go to a run-off election two weeks later.
Winners in the first round | 2012
| Candidate | Constituency | Party | Vote Share |
|---|---|---|---|
| VIRGINIJA BALTRAITIENĖ | Kėdainių | Darbo partija | 57.4 |
| LEONARD TALMONT | Vilniaus - Šalčininkų | Lietuvos lenkų rinkimų akcija | 63.6 |
| ALGIRDAS BUTKEVIČIUS | Vilkaviškio | Lietuvos socialdemokratų partija | 68.7 |
Winners in the first round | 2016
| Candidate | Constituency | Party | Vote Share |
|---|---|---|---|
| POVILAS URBŠYS | Vakarinė | Išsikėlė pats | 51.3 |
| INGRIDA ŠIMONYTĖ | Antakalnio | Tėvynės sąjunga - Lietuvos krikščionys demokratai | 53.3 |
| RIMA BAŠKIENĖ | Kuršėnų-Dainų | Lietuvos valstiečių ir žaliųjų sąjunga | 51.6 |
| LEONARD TALMONT | Šalčininkų-Vilniaus | Lietuvos lenkų rinkimų akcija-Krikščioniškų šeimų sąjunga | 67.9 |
| ČESLAV OLŠEVSKI | Medininkų | Lietuvos lenkų rinkimų akcija-Krikščioniškų šeimų sąjunga | 60.2 |
Winners in the first round | 2020
| Candidate | Constituency | Party | Vote Share |
|---|---|---|---|
| INGRIDA ŠIMONYTĖ | Antakalnio | Tėvynės sąjunga – Lietuvos krikščionys demokratai | 62.6 |
| BEATA PETKEVIČ | Šalčininkų–Vilniaus | Lietuvos lenkų rinkimų akcija - Krikščioniškų šeimų sąjunga | 62.2 |
| ČESLAV OLŠEVSKI | Medininkų | Lietuvos lenkų rinkimų akcija - Krikščioniškų šeimų sąjunga | 55.8 |
Vote shifts from Round I to Round II
Graphical comparison of the votes won by the top two candidates in Round I and Round II show distinct party-by-party behavior depending on the party of the first round winner.
2012

2016

Rose Graphs
These graphs try to present an overview of how votes are split among several parties in the first and second rounds.
2012

2016

2020 | Round I

First round vote share
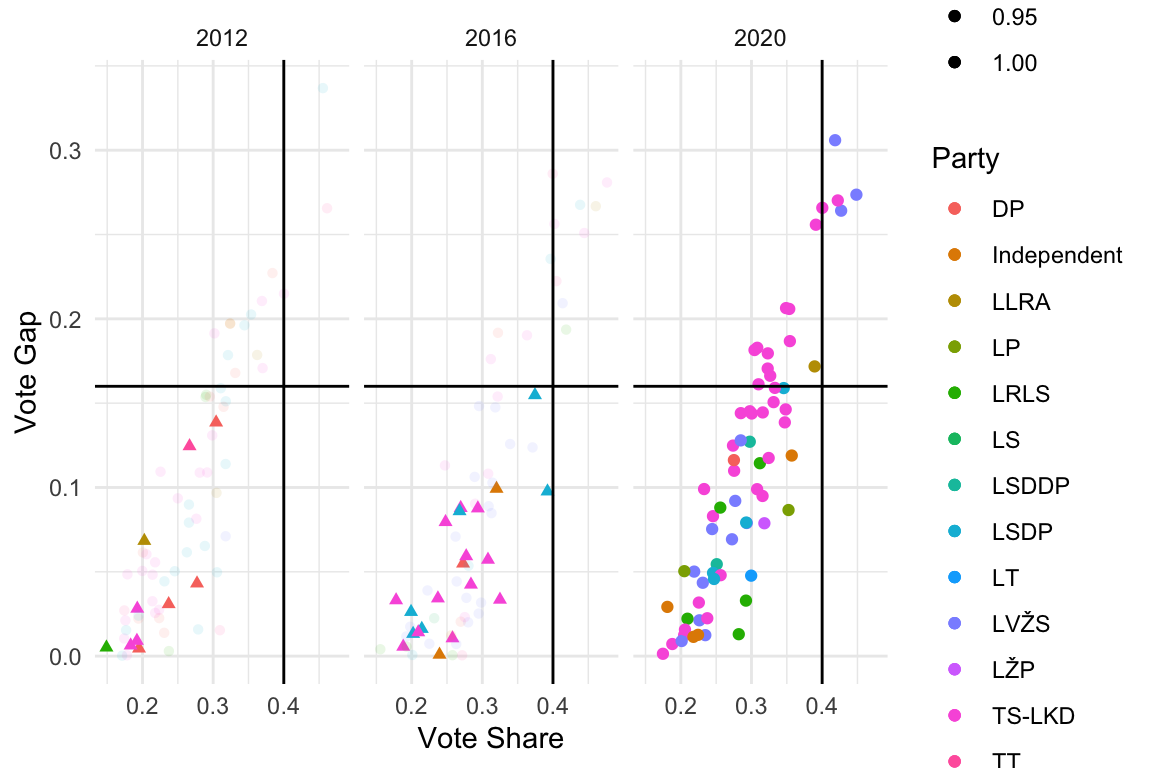
Success rates
- 85% of firstround winners won the second round in 2012
- 69% of firstround winners won the second round in 2016
- This masks wide variation among parties and between years
- TS-LKD retained their lead in 87.5% times in 2012 but only 40% in 2016
Success Rates | 2012
| year | Party | Won | Lost | Total | Success Rate (%) |
|---|---|---|---|---|---|
| 2012 | DP | 8 | 4 | 12 | 66.66667 |
| 2012 | Independent | 2 | 0 | 2 | 100.00000 |
| 2012 | LLRA | 2 | 1 | 3 | 66.66667 |
| 2012 | LRLS | 3 | 1 | 4 | 75.00000 |
| 2012 | LSDP | 18 | 0 | 18 | 100.00000 |
| 2012 | LVŽS | 1 | 0 | 1 | 100.00000 |
| 2012 | TS-LKD | 21 | 3 | 24 | 87.50000 |
| 2012 | TT | 3 | 1 | 4 | 75.00000 |
| 2012 | All | 58 | 10 | 68 | 85.29412 |
Success Rates | 2016
| year | Party | Won | Lost | Total | Success Rate (%) |
|---|---|---|---|---|---|
| 2016 | DP | 2 | 1 | 3 | 66.66667 |
| 2016 | Independent | 1 | 2 | 3 | 33.33333 |
| 2016 | LLRA | 1 | 0 | 1 | 100.00000 |
| 2016 | LRLS | 4 | 0 | 4 | 100.00000 |
| 2016 | LS | 1 | 0 | 1 | 100.00000 |
| 2016 | LSDP | 4 | 6 | 10 | 40.00000 |
| 2016 | LVŽS | 20 | 0 | 20 | 100.00000 |
| 2016 | TS-LKD | 10 | 12 | 22 | 45.45455 |
| 2016 | TT | 3 | 0 | 3 | 100.00000 |
| 2016 | All | 46 | 21 | 67 | 68.65672 |
Success Rates | 2020
?
Predictions | Part A
We will look at the 68 seats being contested in Round II in 2020.
Part A
For those where the first round winner has 40% of the vote or who lead their opponents by 16% we will assume they will win the second round.
This gives 16 outcomes.
| Party | Seats |
|---|---|
| LLRA | 1 |
| LVŽS | 3 |
| TS-LKD | 12 |
Part A | List
| Constituency | First Round Vote Share (%) | Party |
|---|---|---|
| 2. Naujamiesčio–Naujininkų | 32.31129 | TS-LKD |
| 4. Žirmūnų | 39.11286 | TS-LKD |
| 7. Justiniškių–Viršuliškių | 30.81669 | TS-LKD |
| 8. Pilaitės–Karoliniškių | 30.99478 | TS-LKD |
| 9. Lazdynų | 34.89190 | TS-LKD |
| 10. Naujosios Vilnios | 35.34312 | TS-LKD |
| 11. Panerių–Grigiškių | 30.42785 | TS-LKD |
| 12. Verkių | 42.21479 | TS-LKD |
Part A | List
| Constituency | First Round Vote Share (%) | Party |
|---|---|---|
| 17. Petrašiūnų–Gričiupio | 35.43172 | TS-LKD |
| 20. Centro–Žaliakalnio | 40.02344 | TS-LKD |
| 39. Žemaitijos šiaurinė | 44.84981 | LVŽS |
| 44. Radviliškio–Tytuvėnų | 32.29268 | TS-LKD |
| 45. Šiaulių krašto | 42.69021 | LVŽS |
| 47. Žiemgalos rytinė | 32.65018 | TS-LKD |
| 52. Nalšios šiaurinė | 41.83574 | LVŽS |
| 55. Nemenčinės | 38.93504 | LLRA |
Predictions | Part B
What about the other 52 seats?
Part B | Vote shifts?

Vote shifts
There are clues here but I don’t have the expertise or time to try redistributing votes.
If I could I would be looking at how votes reallocated between like and unlike parties in 2012 and 2016.
This is why the rose plots may be helpful.
A probabilistic approach
I’ll try applying a Monte Carlo approach using estimates of probability of winning a run-off and then simulating this multiple times.
First, we’ll average the probability of a party winning a run-off across the 2012 and 2016 elections.
| Party | Won | Lost | Total | Success Rate (%) |
|---|---|---|---|---|
| DP | 10 | 5 | 15 | 66.66667 |
| Independent | 3 | 2 | 5 | 60.00000 |
| LLRA | 3 | 1 | 4 | 75.00000 |
| LRLS | 7 | 1 | 8 | 87.50000 |
| LS | 1 | 0 | 1 | 100.00000 |
| LSDP | 22 | 6 | 28 | 78.57143 |
| LVŽS | 21 | 0 | 21 | 100.00000 |
| TS-LKD | 31 | 15 | 46 | 67.39130 |
| TT | 6 | 1 | 7 | 85.71429 |
This provides an overestimate, because it includes the sure wins already accounted for by the heuristic in part A.
Adjusted success rates
| Party | Won | Lost | Total | Success Rate (%) |
|---|---|---|---|---|
| DP | 7 | 5 | 12 | 58.33333 |
| Independent | 1 | 2 | 3 | 33.33333 |
| LLRA | 1 | 1 | 2 | 50.00000 |
| LRLS | 6 | 1 | 7 | 85.71429 |
| LS | 1 | 0 | 1 | 100.00000 |
| LSDP | 16 | 6 | 22 | 72.72727 |
| LVŽS | 20 | 0 | 20 | 100.00000 |
| TS-LKD | 22 | 15 | 37 | 59.45946 |
| TT | 3 | 1 | 4 | 75.00000 |
Probabilistic Approach | Continued
We’ll apply a maximum of 80% and assign a typical chance of success of 60% where we don’t have earlier data.
| Party | Won | Lost | Total | Success Rate (%) | Probability |
|---|---|---|---|---|---|
| DP | 7 | 5 | 12 | 58.33333 | 58.33333 |
| Independent | 1 | 2 | 3 | 33.33333 | 33.33333 |
| LLRA | 1 | 1 | 2 | 50.00000 | 50.00000 |
| LRLS | 6 | 1 | 7 | 85.71429 | 80.00000 |
| LS | 1 | 0 | 1 | 100.00000 | 80.00000 |
| LSDP | 16 | 6 | 22 | 72.72727 | 72.72727 |
| LVŽS | 20 | 0 | 20 | 100.00000 | 80.00000 |
| TS-LKD | 22 | 15 | 37 | 59.45946 | 59.45946 |
| TT | 3 | 1 | 4 | 75.00000 | 75.00000 |
| LP | 0 | 0 | 0 | NA | 60.00000 |
| LT | 0 | 0 | 0 | NA | 60.00000 |
| LSDDP | 0 | 0 | 0 | NA | 60.00000 |
| LŽP | 0 | 0 | 0 | NA | 60.00000 |
Simulate \(5\times 10^{4}\) times
- Now the second round of the election is simulated \(5\times 10^{4}\) times
- Essentially a weighted coin is being flipped for each constituency in each simulated election
- The probability of the leader winning is given by the adjusted probabilities we have calculated — if they lose, the challenger wins the seat
- The many simulations are then compiled to see how many seats on average the party will win — the “expected” number of seats
| Party | ExpectedSeats | Rounded |
|---|---|---|
| DP | 0.58396 | 1 |
| Independent | 2.01430 | 2 |
| LP | 3.23392 | 3 |
| LRLS | 5.07038 | 5 |
| LSDDP | 1.87766 | 2 |
| LSDP | 5.39150 | 5 |
| LT | 0.60188 | 1 |
| LVŽS | 13.79122 | 14 |
| LŽP | 0.59760 | 1 |
| TS-LKD | 18.42154 | 18 |
| All | 51.58396 | 52 |
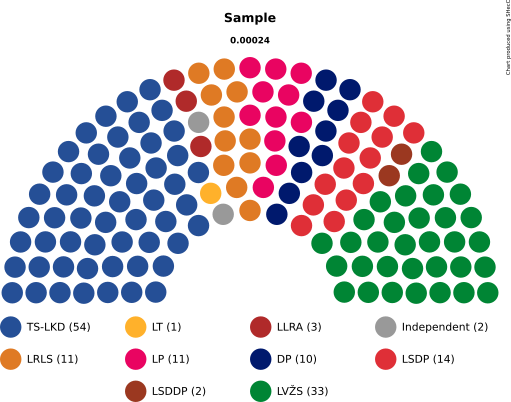
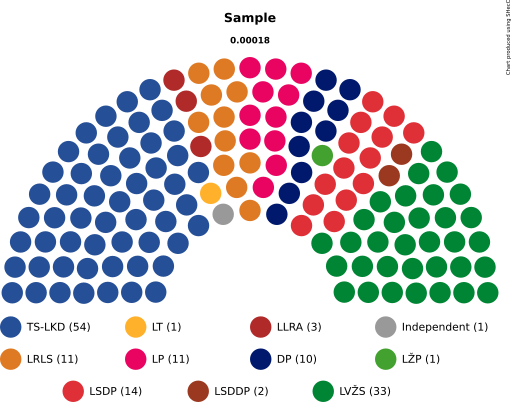
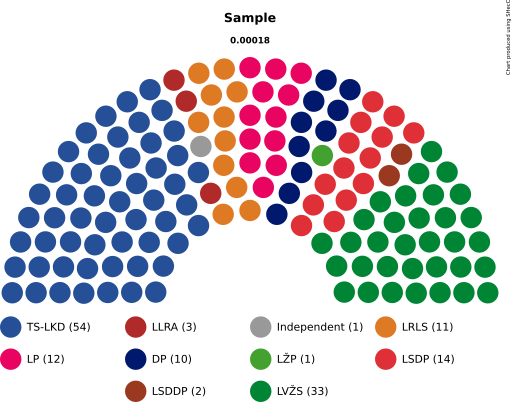
Histograms of Seat Allocation
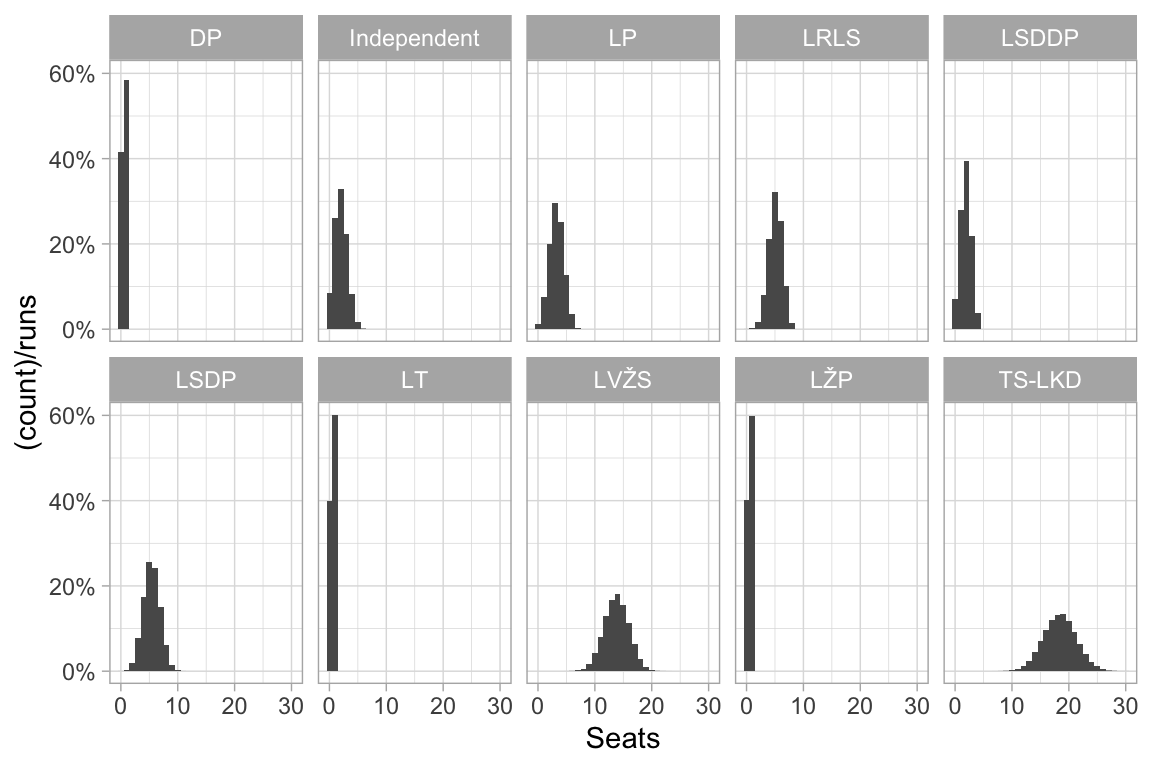
After \(5\times 10^{4}\) simulations.
Histograms | Comments
- The histograms show the distribution of the different numbers of seats for each party
- The lump being further right means that the party is likely to win more seats
- A narrow lump indicates that the party’s chances are limited in a tight range
- The histograms for the LT, DP and LŽP parties are not very useful. They roughly show that the party has about a 60% chance of winning the seat where they are leading, but this is determined for the LT and LŽP parties by the guess we made about how “new” parties would do.
Details
Minimum numbers of seats across all simulations
kable(summarise_each(TalliedSeatsWide,min))
Maximum numbers of seats across all simulations
kable(summarise_each(TalliedSeatsWide,max))
Top twenty five seat distributions
| DP | Independent | LLRA | LP | LRLS | LS | LSDDP | LSDP | LT | LVŽS | LŽP | TS-LKD | TT | n |
|---|---|---|---|---|---|---|---|---|---|---|---|---|---|
| 1 | 2 | 0 | 3 | 5 | 0 | 2 | 6 | 1 | 14 | 0 | 18 | 0 | 12 |
| 1 | 1 | 0 | 3 | 5 | 0 | 2 | 6 | 1 | 14 | 1 | 18 | 0 | 9 |
| 1 | 1 | 0 | 4 | 5 | 0 | 2 | 6 | 0 | 14 | 1 | 18 | 0 | 9 |
| 1 | 2 | 0 | 3 | 6 | 0 | 2 | 5 | 1 | 13 | 1 | 18 | 0 | 9 |
| 1 | 2 | 0 | 4 | 4 | 0 | 2 | 6 | 1 | 14 | 1 | 17 | 0 | 9 |
| 1 | 2 | 0 | 4 | 5 | 0 | 3 | 5 | 0 | 14 | 1 | 17 | 0 | 9 |
| 1 | 2 | 0 | 4 | 6 | 0 | 2 | 5 | 1 | 13 | 1 | 17 | 0 | 9 |
| 0 | 2 | 0 | 2 | 5 | 0 | 2 | 5 | 1 | 13 | 1 | 20 | 0 | 8 |
| 0 | 2 | 0 | 3 | 4 | 0 | 2 | 5 | 1 | 14 | 1 | 19 | 0 | 8 |
| 0 | 2 | 0 | 3 | 5 | 0 | 2 | 6 | 0 | 12 | 1 | 20 | 0 | 8 |
| 0 | 2 | 0 | 4 | 5 | 0 | 2 | 6 | 1 | 14 | 1 | 16 | 0 | 8 |
| 1 | 1 | 0 | 4 | 5 | 0 | 1 | 6 | 1 | 12 | 1 | 20 | 0 | 8 |
| 1 | 1 | 0 | 4 | 5 | 0 | 1 | 6 | 1 | 14 | 1 | 18 | 0 | 8 |
| 1 | 1 | 0 | 4 | 5 | 0 | 2 | 6 | 1 | 12 | 1 | 19 | 0 | 8 |
| 1 | 2 | 0 | 2 | 4 | 0 | 2 | 6 | 0 | 13 | 1 | 21 | 0 | 8 |
| 1 | 2 | 0 | 3 | 5 | 0 | 2 | 4 | 1 | 13 | 1 | 20 | 0 | 8 |
| 1 | 2 | 0 | 3 | 5 | 0 | 2 | 6 | 1 | 14 | 1 | 17 | 0 | 8 |
| 1 | 2 | 0 | 3 | 5 | 0 | 2 | 7 | 1 | 13 | 1 | 17 | 0 | 8 |
| 1 | 2 | 0 | 3 | 6 | 0 | 1 | 5 | 0 | 14 | 1 | 19 | 0 | 8 |
| 1 | 2 | 0 | 3 | 6 | 0 | 2 | 5 | 1 | 16 | 0 | 16 | 0 | 8 |
| 1 | 2 | 0 | 3 | 6 | 0 | 2 | 6 | 1 | 12 | 1 | 18 | 0 | 8 |
| 1 | 2 | 0 | 4 | 5 | 0 | 2 | 5 | 1 | 13 | 0 | 19 | 0 | 8 |
| 1 | 2 | 0 | 4 | 5 | 0 | 2 | 6 | 1 | 12 | 1 | 18 | 0 | 8 |
| 0 | 1 | 0 | 3 | 5 | 0 | 2 | 7 | 1 | 13 | 1 | 18 | 0 | 7 |
| 0 | 2 | 0 | 3 | 5 | 0 | 2 | 6 | 1 | 13 | 1 | 18 | 0 | 7 |
Combine the two parts
| Party | Seats A | Seats B | Total Seats |
|---|---|---|---|
| LLRA | 1 | 0 | 1 |
| LVŽS | 3 | 14 | 17 |
| TS-LKD | 12 | 18 | 30 |
| DP | 0 | 1 | 1 |
| Independent | 0 | 2 | 2 |
| LP | 0 | 3 | 3 |
| LRLS | 0 | 5 | 5 |
| LSDDP | 0 | 2 | 2 |
| LSDP | 0 | 5 | 5 |
| LT | 0 | 1 | 1 |
| LŽP | 0 | 1 | 1 |
| All | 16 | 52 | 68 |
Add to the first round results
| Party | Seats MMC | Seats First Round |
|---|---|---|
| TS-LKD | 23 | 1 |
| LVŽS | 16 | 0 |
| DP | 9 | 0 |
| LSDP | 8 | 0 |
| LP | 8 | 0 |
| LRLS | 6 | 0 |
| LLRA | 0 | 2 |
| Party | Seats MMC | Seats First Round | Predicted Seats | Total Seats |
|---|---|---|---|---|
| TS-LKD | 23 | 1 | 30 | 54 |
| LVŽS | 16 | 0 | 17 | 33 |
| DP | 9 | 0 | 1 | 10 |
| LSDP | 8 | 0 | 5 | 13 |
| LP | 8 | 0 | 3 | 11 |
| LRLS | 6 | 0 | 5 | 11 |
| LLRA | 0 | 2 | 1 | 3 |
| Independent | 0 | 0 | 2 | 2 |
| LSDDP | 0 | 0 | 2 | 2 |
| LT | 0 | 0 | 1 | 1 |
| LŽP | 0 | 0 | 1 | 1 |
| All | 70 | 3 | 68 | 141 |
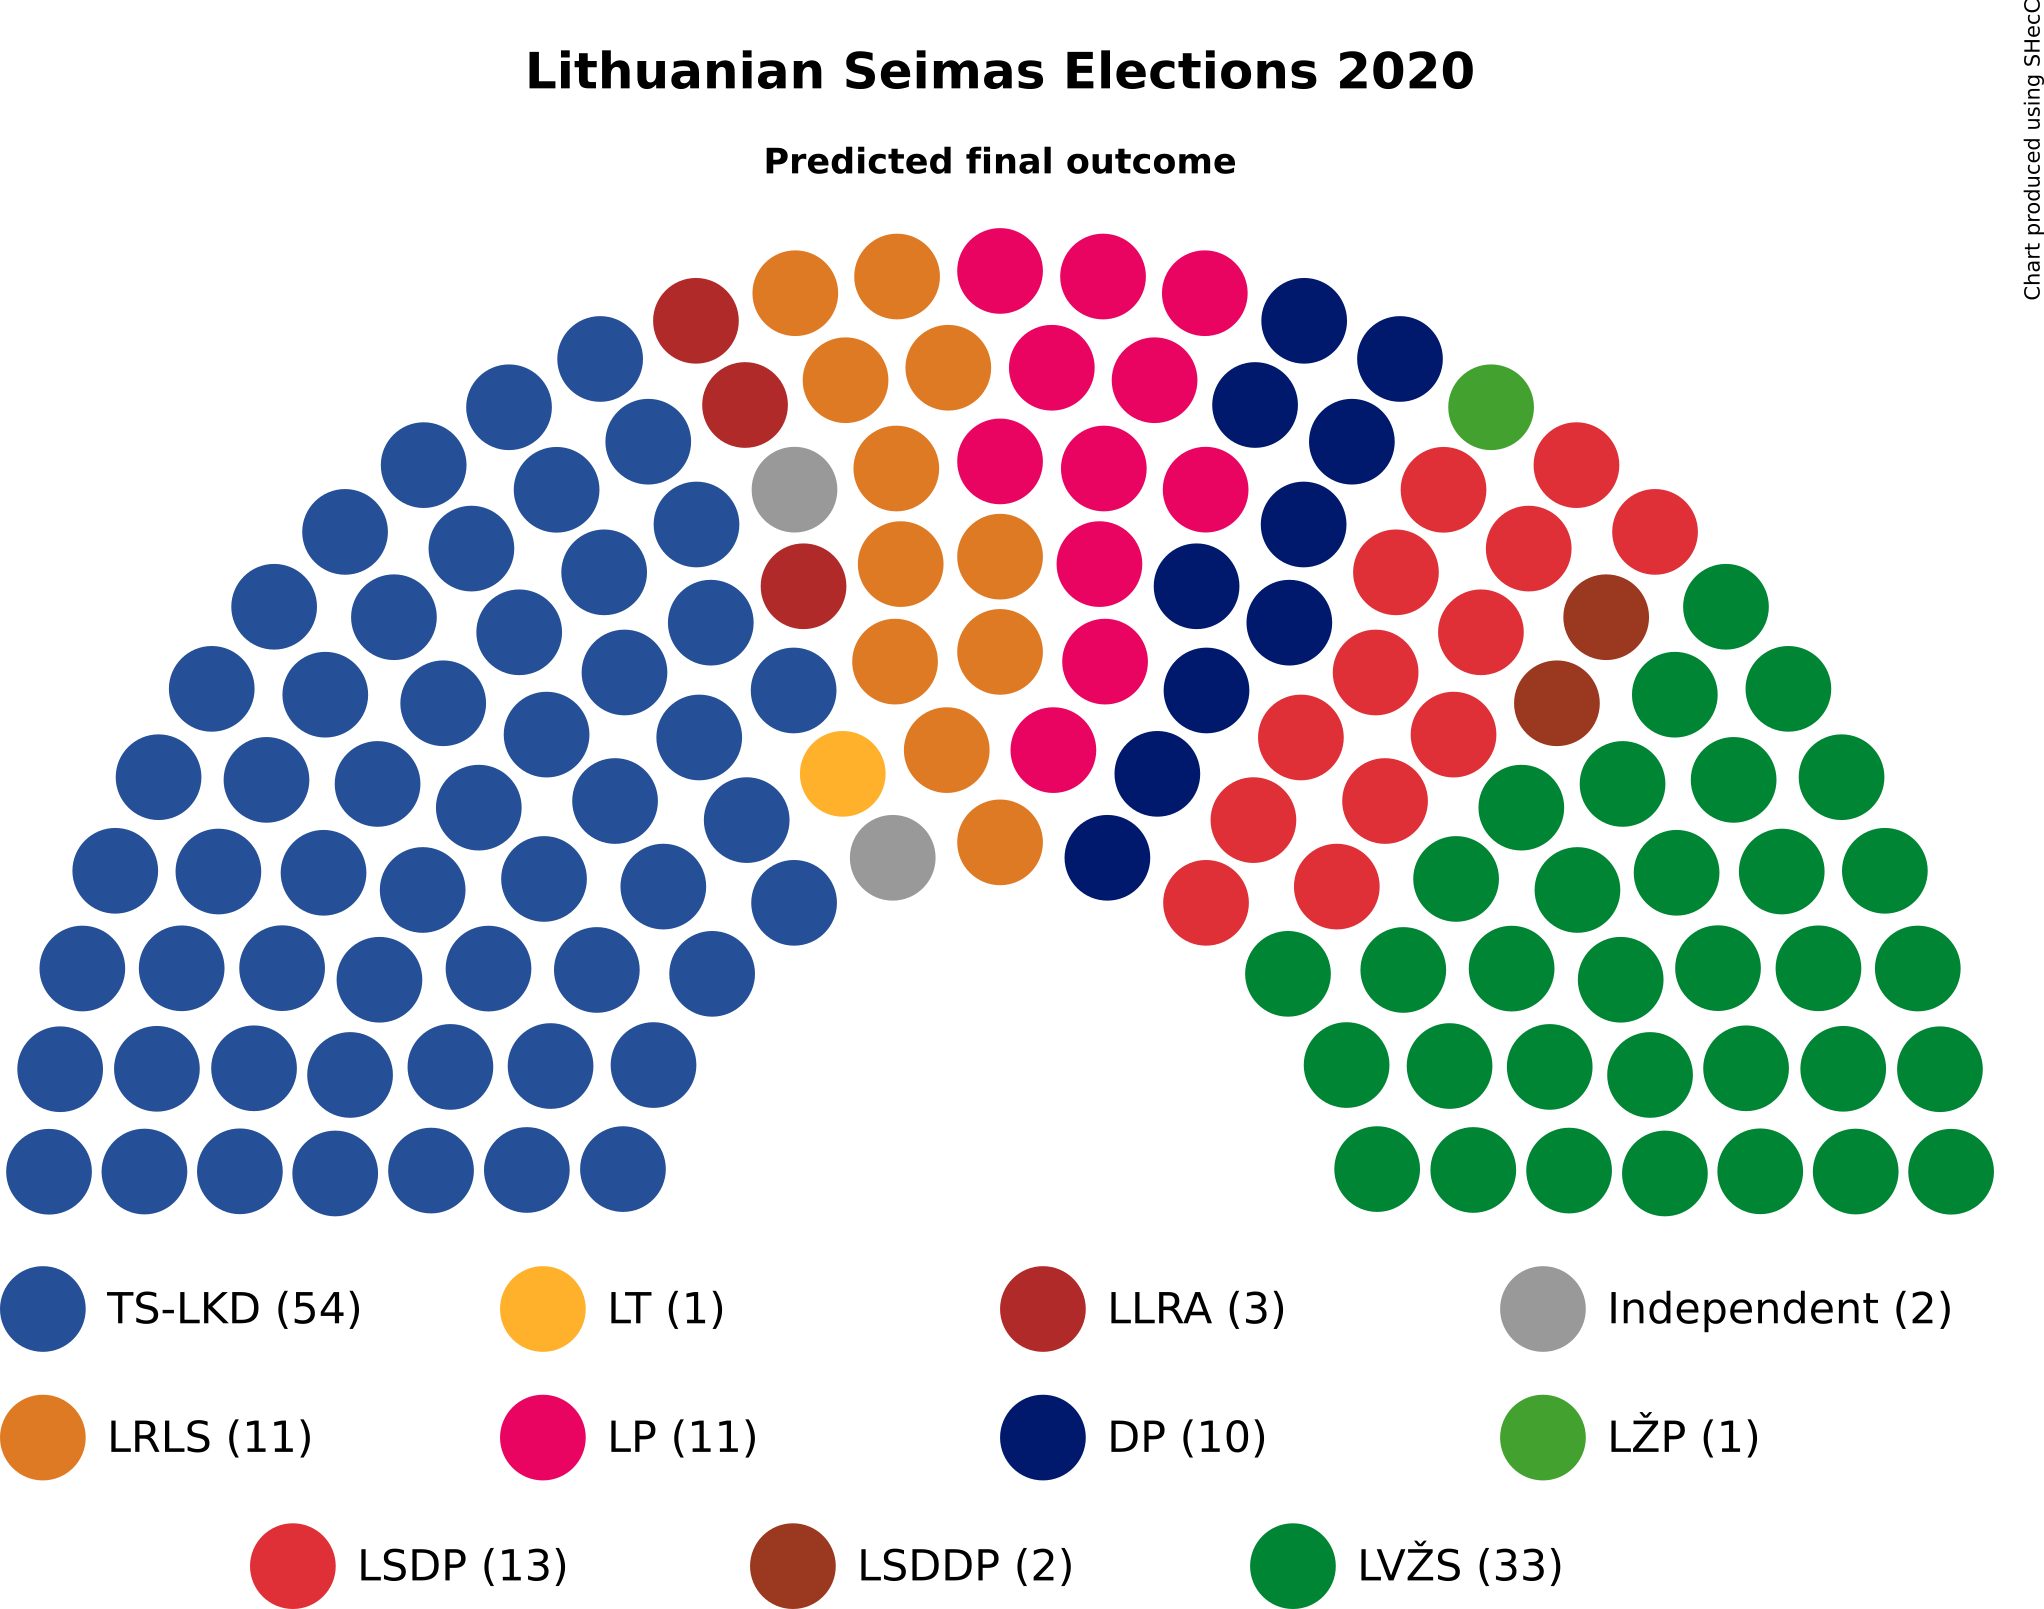
Visualise some of the distributions
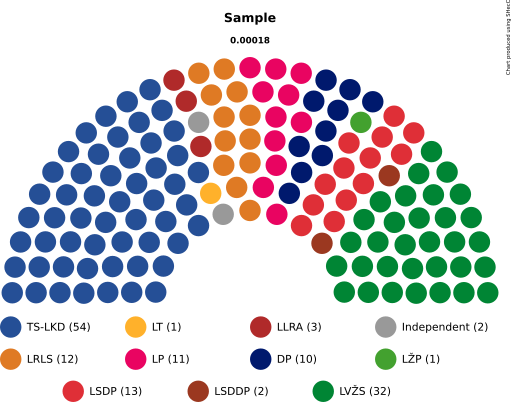
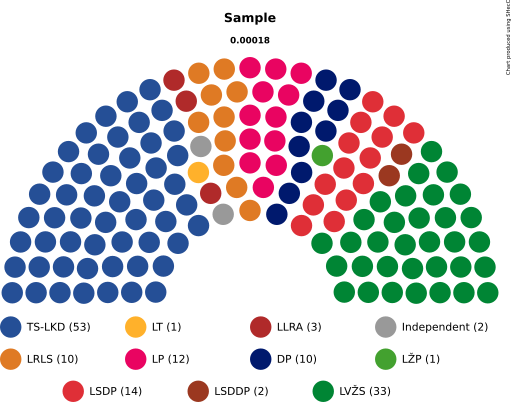
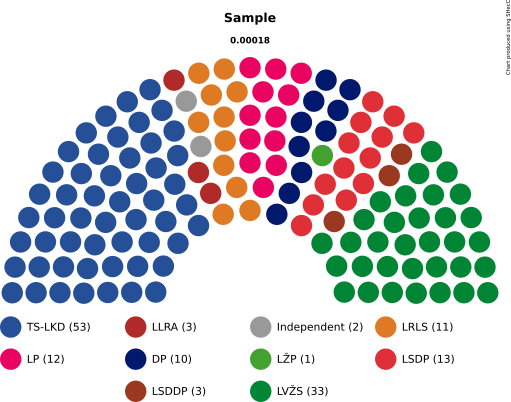
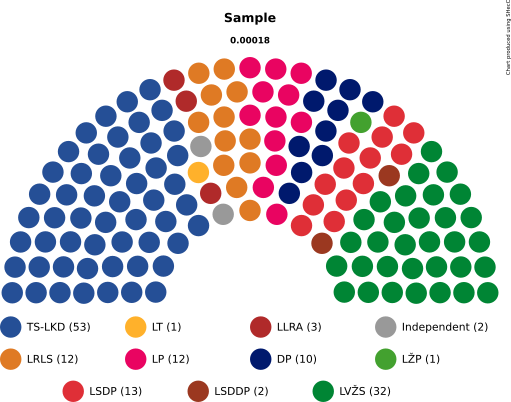
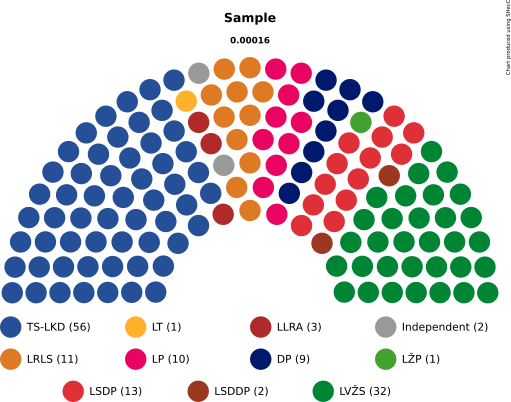
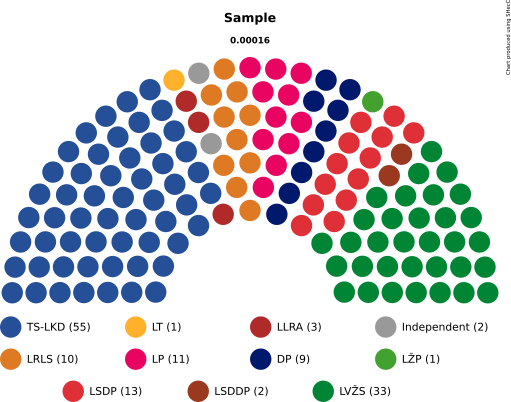
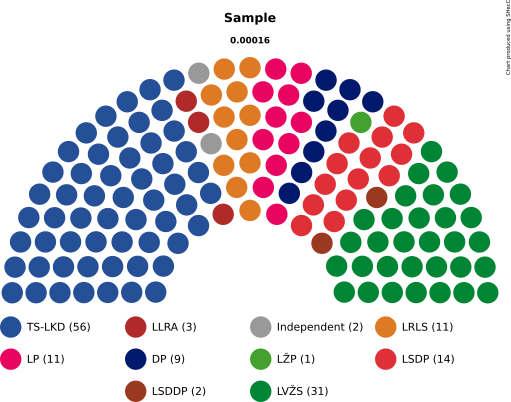
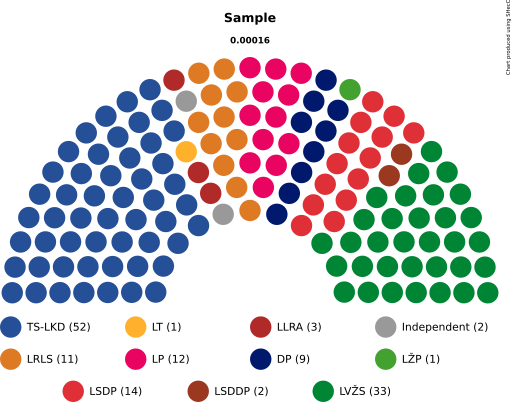
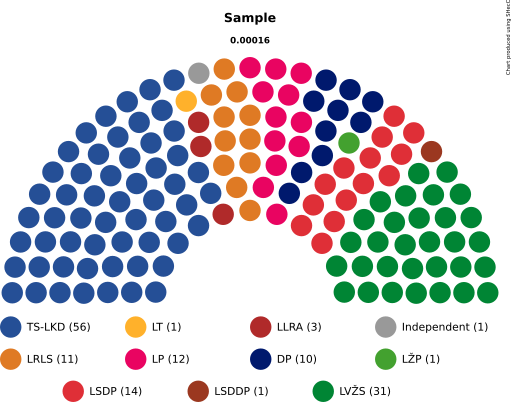

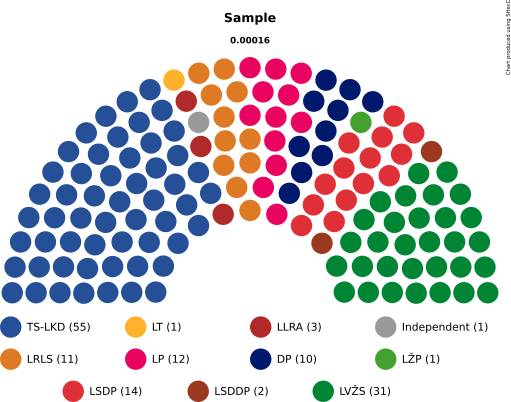
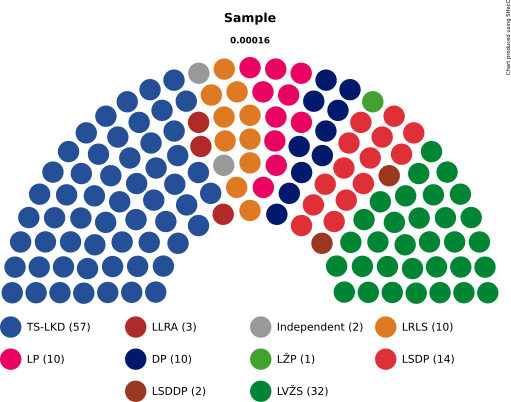
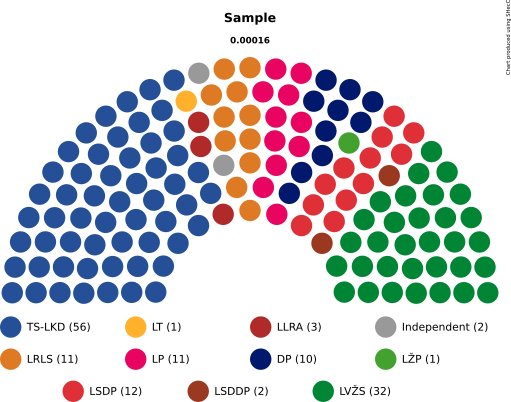
Party key
| Party | Name | Total Seats |
|---|---|---|
| TS-LKD | Tėvynės sąjunga - Lietuvos krikščionys demokratai | 54 |
| LVŽS | Lietuvos valstiečių ir žaliųjų sąjunga | 33 |
| DP | Darbo partija | 10 |
| LSDP | Lietuvos socialdemokratų partija | 13 |
| LP | Laisvės partija | 11 |
| LRLS | Lietuvos Respublikos liberalų sąjūdis | 11 |
| LLRA | Lietuvos lenkų rinkimų akcija - Krikščioniškų šeimų sąjunga | 3 |
| Independent | Independent | 2 |
| LSDDP | Lietuvos socialdemokratų darbo partija | 2 |
| LT | Partija „Laisvė ir teisingumas“ | 1 |
| LŽP | Lietuvos žaliųjų partija | 1 |